Preparation is the key to success in any interview. In this post, we’ll explore crucial Operations Planning and Forecasting interview questions and equip you with strategies to craft impactful answers. Whether you’re a beginner or a pro, these tips will elevate your preparation.
Questions Asked in Operations Planning and Forecasting Interview
Q 1. Explain your experience with different forecasting methodologies (e.g., ARIMA, exponential smoothing, causal models).
Forecasting methodologies are crucial for accurate operations planning. I have extensive experience with several key techniques, each best suited for different data characteristics and forecasting horizons.
- ARIMA (Autoregressive Integrated Moving Average): This statistical model is excellent for time series data exhibiting trends and seasonality. It uses past data points to predict future values. For instance, I used ARIMA to forecast daily website traffic for an e-commerce client, leveraging historical data to predict peak demand periods and optimize server capacity. The model’s parameters (p, d, q) are carefully selected through techniques like ACF and PACF analysis to find the optimal fit.
ARIMA(p,d,q) - Exponential Smoothing: This method assigns exponentially decreasing weights to older data points, making it ideal for data with evolving trends. Simple exponential smoothing is suitable for stable data, while Holt-Winters models account for trends and seasonality. I successfully applied Holt-Winters to forecast monthly sales for a retail company, capturing seasonal fluctuations and improving inventory planning. The key parameter alpha (smoothing factor) determines the responsiveness to recent data. A higher alpha gives more weight to recent data.
- Causal Models (Regression Analysis): These models explore the relationship between the variable being forecasted (dependent variable) and other influencing factors (independent variables). For example, I used regression analysis to forecast demand for construction materials, incorporating factors like housing starts, interest rates, and government spending. This allowed us to anticipate fluctuations in demand based on external market conditions.
Choosing the right methodology depends on factors like data availability, forecast horizon, and the presence of trends and seasonality. Often, a combination of approaches provides the most accurate and robust forecast.
Q 2. How do you handle forecast inaccuracies and adjust your plans accordingly?
Forecast inaccuracies are inevitable. My approach focuses on proactive monitoring, root cause analysis, and adaptive planning.
- Monitoring and Tracking: I consistently track forecast errors using metrics like Mean Absolute Deviation (MAD) and Mean Absolute Percentage Error (MAPE). This allows for early detection of significant deviations.
- Root Cause Analysis: When significant errors occur, I investigate the underlying causes. This could involve reviewing data quality, identifying unforeseen external factors (e.g., economic downturn, competitor actions), or evaluating the appropriateness of the chosen forecasting model.
- Adaptive Planning: Based on the analysis, I adjust plans accordingly. This could involve adjusting production schedules, re-allocating resources, or modifying inventory levels. For instance, if a forecast significantly underestimates demand, I’ll initiate expedited production runs or explore outsourcing options. Conversely, if the forecast overestimates demand, adjustments to production and inventory are needed to avoid excess stock.
- Scenario Planning: Developing multiple forecasts based on different assumptions helps anticipate a wider range of possibilities and prepare for uncertainties.
It’s crucial to remember that forecasting is an iterative process, and continuous improvement is key. Regular review and refinement of models and plans based on feedback are essential.
Q 3. Describe your experience with inventory management techniques (e.g., EOQ, safety stock).
Inventory management is critical for optimizing costs and ensuring customer service levels. I’m familiar with various techniques, including:
- Economic Order Quantity (EOQ): EOQ helps determine the optimal order size to minimize the total cost of inventory, considering ordering costs and holding costs. I’ve used EOQ models in numerous projects, adjusting the model to consider factors like lead times, demand variability, and storage capacity.
EOQ = √(2DS/H)where D is annual demand, S is ordering cost, and H is holding cost per unit. - Safety Stock: This buffer stock protects against demand variability and lead time uncertainty. Calculating safety stock requires understanding demand variability and lead time distributions. I’ve implemented safety stock calculations using statistical methods, considering factors like service level requirements and historical data. A higher service level means more safety stock and higher holding costs.
- Just-in-Time (JIT) Inventory: In some cases, a JIT approach minimizes inventory by receiving materials only when needed. This is highly effective for products with stable demand and reliable suppliers. I have used JIT principles in projects involving high-volume manufacturing environments, although it requires close coordination with suppliers and sophisticated scheduling capabilities.
The selection of the best technique depends on factors like product characteristics, demand variability, and supply chain dynamics. Often, a combination of methods is employed to achieve optimal inventory management.
Q 4. How do you balance supply and demand to optimize inventory levels?
Balancing supply and demand is the core of effective inventory management and operations planning. My approach integrates forecasting, inventory management, and capacity planning techniques to achieve this goal.
- Demand Forecasting: Accurate forecasting is the foundation. I use the methodologies discussed earlier to predict future demand, considering factors like seasonality, trends, and market conditions.
- Capacity Planning: Once demand is forecasted, I assess whether existing capacity (production, storage, distribution) is sufficient. This involves evaluating resources and potentially adjusting capacity through measures like overtime, new equipment, or outsourcing.
- Inventory Optimization: Using EOQ and safety stock calculations, I determine optimal inventory levels to meet forecasted demand while minimizing costs. This considers lead times, storage costs, and desired service levels.
- Sales & Operations Planning (S&OP): S&OP is a crucial process that aligns sales forecasts with operational capabilities. It involves cross-functional collaboration to reconcile supply and demand plans, ensuring that inventory levels support sales targets while avoiding overstocking or stockouts.
- Real-time Monitoring & Adjustment: Continuous monitoring of actual demand and inventory levels allows for adjustments to plans as needed. This could involve expedited shipments, production adjustments, or changes to marketing strategies.
Balancing supply and demand is a dynamic process requiring constant monitoring and adaptation. Technology such as demand planning software can significantly enhance the efficiency and accuracy of this process.
Q 5. Explain your understanding of capacity planning and resource allocation.
Capacity planning and resource allocation are intertwined and crucial for optimizing operational efficiency. Capacity planning involves determining the resources required to meet forecasted demand, while resource allocation involves assigning those resources effectively.
- Capacity Requirements: I determine capacity needs based on forecasted demand, considering factors like production time, equipment availability, and labor requirements. This might involve analyzing production capacity, warehouse space, transportation capacity, or even the capacity of customer service teams.
- Resource Identification: I identify the resources needed – equipment, personnel, materials, etc. This includes evaluating current resources and identifying potential shortages or bottlenecks.
- Resource Allocation: I allocate resources based on priorities, considering factors like cost, efficiency, and risk. This might involve scheduling production runs, assigning personnel to tasks, or allocating warehouse space efficiently.
- Capacity Expansion/Contraction: When capacity constraints are anticipated, I evaluate options for expansion (e.g., acquiring new equipment, hiring additional staff) or contraction (e.g., reducing overtime, streamlining processes) based on long-term demand projections.
- Contingency Planning: I develop contingency plans to address unforeseen events that could impact capacity or resource availability (e.g., equipment failure, unexpected demand spikes).
Effective capacity planning and resource allocation are key to minimizing costs, optimizing production, and meeting customer demands efficiently. Tools like simulation software and linear programming can assist in the optimization process.
Q 6. How do you use data analysis to improve operations planning and forecasting?
Data analysis is the backbone of effective operations planning and forecasting. I utilize various techniques to extract actionable insights from data.
- Descriptive Analytics: I use descriptive statistics (mean, median, standard deviation) to understand historical data patterns and identify trends and seasonality. Visualizations like charts and graphs make these patterns easier to spot.
- Predictive Analytics: As previously discussed, I apply forecasting techniques (ARIMA, exponential smoothing, regression) to predict future demand and other key performance indicators (KPIs).
- Prescriptive Analytics: I use optimization models and simulation techniques to find the best course of action given various constraints and objectives. This could involve optimizing production schedules, inventory levels, or resource allocation.
- Data Mining and Machine Learning: In some cases, I employ machine learning algorithms to uncover hidden patterns and improve forecast accuracy. For example, I may use clustering techniques to segment customers based on their purchasing behavior, leading to more accurate demand forecasts for specific customer groups.
- Data Visualization and Reporting: Creating clear and concise dashboards and reports helps communicate insights and ensures that relevant information is accessible to stakeholders.
The use of data-driven insights is essential for continuous improvement in operations planning and forecasting. The ability to extract meaningful information from large datasets and translate it into actionable recommendations is crucial for successful operations.
Q 7. Describe a time you had to make a critical decision under pressure related to operations.
During a peak season for an online retailer, a significant supplier delay threatened to cause major stockouts. This could have severely impacted sales and customer satisfaction.
Under intense pressure, I first gathered the team to assess the impact of the delay on various product lines. We analyzed the existing inventory levels, the expected demand for each affected product, and the potential lead times from alternative suppliers.
We then prioritized the products based on their sales volume and profit margins. We decided to immediately contact alternative suppliers for the highest-priority products, negotiating expedited shipping to minimize the impact on sales. For lower-priority products, we implemented a backorder management system to keep customers informed and manage expectations.
Finally, we worked with the marketing team to adjust promotional campaigns, focusing on products that were not affected by the supplier delay. This helped mitigate the loss of sales during the crisis.
Through decisive action and effective communication, we managed to minimize the impact of the supplier delay, maintaining a high level of customer service and preventing significant financial losses. The experience highlighted the importance of maintaining strong relationships with suppliers, diversifying the supply chain, and having a robust contingency plan.
Q 8. What metrics do you use to measure the effectiveness of your operations planning?
Measuring the effectiveness of operations planning relies on a suite of key performance indicators (KPIs) that reflect efficiency, accuracy, and responsiveness. These metrics are often categorized into several key areas:
- Inventory Management: Inventory turnover rate, carrying costs, stockout rates, and fill rates all indicate how effectively we manage inventory levels. A high inventory turnover suggests efficient inventory movement, while low stockout rates demonstrate excellent fulfillment capacity. For example, a consistently high stockout rate for a best-selling product points to a flaw in our forecasting or ordering process.
- Production Efficiency: Metrics like production lead time (the time it takes to produce a product from order to delivery), on-time delivery rate, and manufacturing cycle efficiency (the ratio of value-added time to total production time) provide insights into the manufacturing process’s effectiveness. A reduction in lead time, coupled with an increase in on-time delivery, is a strong indicator of improvement.
- Cost Management: Tracking unit cost, operating costs, and total cost of ownership (TCO) helps assess the overall cost-effectiveness of the operations plan. A consistent reduction in unit cost demonstrates optimization efforts within production and supply chain processes.
- Customer Service Levels: Customer satisfaction, order fulfillment speed, and perfect order rate (orders delivered completely and accurately) are crucial metrics. A high perfect order rate shows a well-coordinated process across sales, production and logistics.
The selection of the most relevant KPIs depends on the specific industry, business goals and available data. Regularly monitoring these KPIs allows for continuous improvement and informed decision-making.
Q 9. How do you incorporate seasonality and trends into your forecasting models?
Incorporating seasonality and trends into forecasting models is crucial for accuracy. We typically employ several techniques:
- Time Series Decomposition: This statistical method separates a time series (historical data) into its constituent components: trend, seasonality, and randomness (residuals). Once decomposed, we can model each component separately and then recombine them for a more accurate forecast. For example, we might use exponential smoothing for the trend and a seasonal index for seasonal fluctuations.
Example: Yt = Tt * St * Rt (where Yt is the value at time t, Tt is the trend component, St is the seasonal component, and Rt is the random component) - Regression Analysis: If we identify external factors influencing demand (e.g., marketing campaigns, economic indicators), we can use regression models to incorporate their effect. This approach allows us to predict demand based on these factors and forecast how changes might impact sales.
- Moving Averages: Simple or weighted moving averages can smooth out short-term fluctuations and highlight underlying trends. A weighted moving average assigns higher weights to more recent data points, giving greater importance to current trends.
- ARIMA models (Autoregressive Integrated Moving Average): These sophisticated statistical models are particularly effective for capturing complex patterns in time series data, including both trend and seasonality. They are more complex to implement but offer greater predictive power.
The choice of method depends on the nature of the data and the complexity of the patterns. Often, a combination of techniques provides the most robust and accurate forecasts.
Q 10. What software or tools are you proficient in for operations planning and forecasting (e.g., SAP, Oracle, etc.)?
My proficiency in operations planning and forecasting software includes several leading systems. I have extensive experience with SAP APO (Advanced Planning and Optimization) for demand planning, production planning, and supply network planning. I’m also skilled in using Oracle Demand Management and have worked with specialized forecasting software like Demand Solutions and Forecast Pro. Furthermore, I am comfortable using data analytics tools like Tableau and Power BI for visualizing and interpreting forecasting results. My experience spans various platforms, allowing me to adapt to different business needs and technological environments.
Q 11. Describe your experience with Sales & Operations Planning (S&OP).
Sales & Operations Planning (S&OP) is a critical process that aligns sales and operations functions to create a single, integrated plan. My experience with S&OP involves leading and participating in cross-functional teams to develop and execute integrated business plans. This includes:
- Demand Planning: Collaborating with the sales team to forecast future demand based on historical data, market trends, and sales promotions.
- Supply Planning: Working with operations to determine the capacity and resources required to meet the forecasted demand.
- Reconciliation: Analyzing the differences between sales forecasts and operations capabilities and resolving any gaps.
- Execution: Monitoring the execution of the plan and making necessary adjustments along the way.
- Performance Measurement: Tracking key performance indicators (KPIs) to evaluate the effectiveness of the S&OP process.
In a previous role, I led the implementation of a new S&OP process that significantly improved forecast accuracy, reduced inventory levels, and increased on-time delivery rates. This involved training cross-functional teams, developing standardized processes, and implementing new software tools.
Q 12. How do you communicate your forecasts and plans to stakeholders?
Effective communication of forecasts and plans is essential for buy-in and successful implementation. My approach involves tailoring the communication to the audience and using a variety of methods:
- Executive Summaries: For senior management, I provide concise summaries highlighting key findings, risks, and opportunities.
- Detailed Reports: For operational teams, I provide more detailed reports including data visualizations, charts, and supporting documentation.
- Interactive Dashboards: I leverage tools like Tableau and Power BI to create interactive dashboards that allow stakeholders to explore the data and drill down into details. This allows for easy monitoring of key metrics and identification of potential issues.
- Regular Meetings: I conduct regular meetings with stakeholders to discuss the forecast, address concerns, and solicit feedback. This fosters collaboration and ensures everyone is aligned.
- Storytelling: I translate complex data into simple, understandable narratives that resonate with the audience. Using clear visuals and relatable language improves comprehension and engagement.
Transparency and open communication are paramount. By providing clear explanations and addressing potential questions proactively, I build trust and confidence in the accuracy and reliability of our forecasts and plans.
Q 13. Explain your understanding of supply chain risk management.
Supply chain risk management (SCRM) is the process of identifying, assessing, and mitigating potential disruptions that could impact the flow of goods and services. This involves considering a wide range of factors, including:
- Supplier Risks: Financial instability, production capacity issues, geopolitical events, and natural disasters can all impact supplier reliability.
- Demand Risks: Sudden changes in demand, both positive and negative, can create challenges for meeting customer needs.
- Logistics Risks: Transportation delays, port congestion, and customs issues can disrupt the movement of goods.
- Geopolitical Risks: Political instability, trade wars, and pandemics can significantly impact supply chains.
Effective SCRM involves developing contingency plans, diversifying suppliers, building robust relationships with key partners, and implementing technologies that enhance visibility and responsiveness. Proactive risk assessment and mitigation strategies are crucial for maintaining supply chain resilience.
For instance, during the pandemic, a company might have diversified its sourcing to reduce reliance on a single supplier in a high-risk region. This exemplifies a proactive SCRM strategy that protects against supply disruptions.
Q 14. How do you collaborate with different departments to ensure effective operations planning?
Collaboration is fundamental to effective operations planning. I foster collaboration across departments by:
- Establishing clear communication channels: Regular meetings, shared online platforms, and collaborative software are essential for keeping everyone informed.
- Building strong relationships: I actively cultivate trust and rapport with colleagues in different departments to ensure open communication and mutual support.
- Defining shared goals and objectives: By aligning everyone around common goals, we can work together more effectively towards achieving our shared objectives.
- Utilizing collaborative tools: Tools like shared spreadsheets, project management software, and communication platforms facilitate teamwork and data sharing.
- Establishing clear roles and responsibilities: Each team member has a well-defined role to ensure accountability and minimize confusion.
- Promoting a culture of shared ownership: Encouraging input and feedback from all stakeholders enhances buy-in and ensures that everyone feels responsible for the success of the plan.
For example, to effectively manage inventory levels, I collaborate closely with the purchasing department to ensure timely procurement of raw materials. Similarly, I work with the marketing and sales teams to accurately forecast demand, minimizing discrepancies between supply and demand.
Q 15. Describe your process for developing and implementing an operations plan.
Developing and implementing an operations plan is a systematic process that ensures efficient resource allocation and meets organizational goals. It begins with a thorough understanding of market demand and internal capabilities. I typically follow these steps:
- Demand Forecasting: This involves analyzing historical data, market trends, and seasonality to predict future demand. Techniques like moving averages, exponential smoothing, and ARIMA modeling are used, depending on data characteristics and forecast horizon.
- Capacity Planning: Once demand is forecasted, I assess whether existing capacity (equipment, labor, facilities) is sufficient to meet it. This might involve analyzing production lines, workforce availability, and potential bottlenecks.
- Resource Allocation: This involves assigning resources – materials, labor, and equipment – to various production activities based on the demand forecast and capacity analysis. This often uses optimization techniques to minimize costs and maximize efficiency.
- Production Scheduling: A detailed schedule is developed to outline when specific tasks will be performed, ensuring smooth workflow and on-time delivery. Tools like Gantt charts and MRP (Material Requirements Planning) systems are valuable here.
- Implementation and Monitoring: The plan is implemented, and key performance indicators (KPIs) like production output, lead times, and inventory levels are monitored closely. Regular reviews and adjustments are crucial to adapt to changing conditions.
- Continuous Improvement: The entire process is constantly evaluated for areas of improvement. Lean principles and Six Sigma methodologies can be used to identify waste, reduce errors, and streamline operations.
For instance, in a previous role, I implemented a new production scheduling system that reduced lead times by 15% and improved on-time delivery by 10%. This involved a detailed analysis of bottlenecks in the production line, followed by adjustments to the workflow and resource allocation.
Career Expert Tips:
- Ace those interviews! Prepare effectively by reviewing the Top 50 Most Common Interview Questions on ResumeGemini.
- Navigate your job search with confidence! Explore a wide range of Career Tips on ResumeGemini. Learn about common challenges and recommendations to overcome them.
- Craft the perfect resume! Master the Art of Resume Writing with ResumeGemini’s guide. Showcase your unique qualifications and achievements effectively.
- Don’t miss out on holiday savings! Build your dream resume with ResumeGemini’s ATS optimized templates.
Q 16. How do you handle unexpected disruptions to your operations plan?
Unexpected disruptions are inevitable in operations planning. My approach involves a combination of proactive measures and reactive responses. Proactive measures include:
- Robust Planning: Building in buffer capacity and safety stock to absorb minor shocks.
- Contingency Planning: Developing alternative plans for various potential disruptions (e.g., supplier delays, equipment failures, natural disasters).
- Risk Assessment: Identifying potential disruptions and assessing their likelihood and impact.
When a disruption occurs, my reactive approach includes:
- Rapid Assessment: Quickly assessing the nature and scope of the disruption.
- Communication: Immediately communicating with relevant stakeholders (suppliers, customers, internal teams).
- Problem-Solving: Utilizing problem-solving techniques like root cause analysis (RCA) to identify the underlying cause of the disruption and implement corrective actions.
- Plan Adjustment: Modifying the existing plan to mitigate the impact of the disruption, potentially prioritizing critical tasks and reallocating resources.
For example, when a major supplier experienced a fire, we immediately activated our contingency plan, sourcing alternative suppliers and prioritizing production of the most critical products. This minimized the impact on our customers and allowed us to recover quickly.
Q 17. What is your experience with lean manufacturing or six sigma principles?
I have extensive experience applying both lean manufacturing and Six Sigma principles to optimize operations. Lean focuses on eliminating waste in all forms (muda), while Six Sigma emphasizes reducing variation and improving quality. I’ve successfully implemented lean tools such as 5S (Sort, Set in Order, Shine, Standardize, Sustain), value stream mapping, and Kaizen events to streamline processes and reduce lead times. In terms of Six Sigma, I’m a certified Green Belt and have used DMAIC (Define, Measure, Analyze, Improve, Control) methodology on several projects to improve quality and reduce defects. For instance, using DMAIC, I led a project to reduce defects in a packaging process by 80%, resulting in significant cost savings and improved customer satisfaction.
Q 18. How do you measure the accuracy of your forecasts?
Measuring forecast accuracy is crucial for improving future forecasting performance. Common metrics include:
- Mean Absolute Deviation (MAD): The average absolute difference between forecasted and actual values. A lower MAD indicates higher accuracy.
- Mean Squared Error (MSE): The average squared difference between forecasted and actual values. It gives more weight to larger errors.
- Root Mean Squared Error (RMSE): The square root of MSE. It’s easier to interpret since it’s in the same units as the data.
- Mean Absolute Percentage Error (MAPE): The average absolute percentage difference between forecasted and actual values. It’s useful for comparing forecasts across different scales.
I regularly calculate these metrics to evaluate the performance of our forecasting models and identify areas for improvement. For example, if the MAPE for a particular product is consistently high, I would investigate the underlying causes and potentially refine the forecasting model or gather additional data.
Q 19. Explain your understanding of demand forecasting techniques.
Demand forecasting techniques vary depending on data availability, forecast horizon, and desired accuracy. Some common techniques I use include:
- Qualitative Methods: These methods rely on expert judgment and intuition. Examples include market research, Delphi method, and sales force composite.
- Quantitative Methods: These methods utilize historical data to predict future demand. Examples include:
- Moving Average: Calculates the average demand over a specific period.
- Exponential Smoothing: Assigns weights to historical data, giving more weight to recent data.
- ARIMA (Autoregressive Integrated Moving Average): A sophisticated statistical model used for time series data.
- Regression Analysis: Identifies the relationship between demand and other variables (e.g., price, advertising).
The choice of technique depends on factors like data availability and forecast horizon. For example, for short-term forecasts, exponential smoothing might be sufficient, while for long-term forecasts, ARIMA or regression analysis might be more appropriate.
Q 20. How do you prioritize tasks and manage competing demands in operations planning?
Prioritizing tasks and managing competing demands in operations planning requires a structured approach. I typically use techniques such as:
- Prioritization Matrix: A matrix that ranks tasks based on urgency and importance (e.g., Eisenhower Matrix).
- Critical Path Method (CPM): Identifies the sequence of tasks that determine the shortest possible project duration.
- Resource Leveling: Adjusts the schedule to smooth out resource utilization and avoid conflicts.
- Project Management Software: Utilizes tools like MS Project or Jira to track tasks, allocate resources, and monitor progress.
In situations with competing demands, I establish clear priorities based on business objectives, customer needs, and resource constraints. Transparent communication and collaboration with cross-functional teams are crucial to ensure everyone understands the priorities and can effectively contribute.
Q 21. What is your experience with different types of inventory (e.g., raw materials, work-in-progress, finished goods)?
Managing different types of inventory is essential for efficient operations. My experience encompasses all three categories:
- Raw Materials: These are the basic inputs needed for production. Effective management involves forecasting demand, establishing optimal order quantities, and ensuring timely delivery to avoid production delays. I use techniques like Economic Order Quantity (EOQ) to determine the optimal order size.
- Work-in-Progress (WIP): This represents partially completed products. Excessive WIP indicates inefficiencies in the production process. Lean principles are particularly useful in reducing WIP by improving workflow and reducing bottlenecks.
- Finished Goods: These are completed products ready for sale. Managing finished goods inventory involves balancing the need to meet customer demand with the costs of storage and obsolescence. Techniques like Just-in-Time (JIT) inventory management aim to minimize finished goods inventory by producing goods only when they are needed.
In my previous role, I implemented a new inventory management system that reduced raw material inventory by 20% while maintaining production levels. This involved optimizing order quantities, improving forecasting accuracy, and strengthening relationships with our suppliers.
Q 22. Describe your experience with production scheduling and sequencing.
Production scheduling and sequencing are crucial for optimizing manufacturing processes. My experience encompasses developing and implementing schedules using various techniques like MRP (Material Requirements Planning) and Finite Capacity Scheduling (FCS). I’ve worked with both short-term, tactical scheduling to meet immediate demands and long-term, strategic planning to align production with overall business objectives.
For instance, in a previous role, we faced challenges in meeting tight deadlines for a new product launch. By implementing FCS, which considers the actual capacity constraints of our machines, we were able to prioritize critical tasks and significantly reduce lead times. This involved carefully sequencing jobs based on factors like due dates, setup times, and machine capabilities, minimizing idle time and maximizing throughput.
I’m also proficient in using various sequencing rules, such as Shortest Processing Time (SPT), Earliest Due Date (EDD), and Critical Ratio (CR), to optimize job order execution based on specific project requirements. The choice of rule depends heavily on the context; for instance, EDD is ideal when minimizing tardiness is crucial, while SPT prioritizes minimizing overall processing time.
Q 23. How do you use technology to improve the efficiency of your operations?
Technology is a game-changer in operations planning and forecasting. I leverage several tools to enhance efficiency. Enterprise Resource Planning (ERP) systems like SAP or Oracle provide integrated platforms for managing all aspects of operations, from procurement to production to sales. These systems automate many manual processes, improving accuracy and reducing errors.
Furthermore, I utilize advanced analytics software and data visualization tools like Tableau or Power BI to analyze large datasets, identify trends, and create accurate forecasts. This enables data-driven decision-making, allowing us to proactively address potential issues and optimize resource allocation. For example, using predictive analytics, we can forecast demand fluctuations and adjust production levels accordingly, minimizing waste and maximizing profitability.
Additionally, I have experience implementing Manufacturing Execution Systems (MES) for real-time monitoring and control of the production floor. This enhances visibility into production processes, enabling quicker identification and resolution of bottlenecks.
Q 24. What are some common challenges in operations planning and forecasting, and how have you overcome them?
Common challenges in operations planning and forecasting include demand variability, supply chain disruptions, and inaccurate forecasting. Demand variability can significantly impact production planning, leading to either excess inventory or stockouts. Supply chain disruptions, like natural disasters or supplier issues, can cause delays and production stoppages.
To overcome these challenges, I employ a multi-pronged approach. Firstly, I use robust forecasting methods that consider historical data, seasonality, and external factors. Exponential Smoothing and ARIMA models are examples of techniques I’ve successfully employed. Secondly, I build flexibility into the production system, allowing for quick adjustments to meet changing demand. This might involve holding safety stock, utilizing flexible manufacturing processes, or collaborating closely with suppliers to ensure reliable supply.
Finally, I regularly review and update forecasting models, incorporating new data and insights to improve their accuracy. For instance, during a period of unpredictable market changes, we transitioned from a simple moving average forecasting model to a more sophisticated ARIMA model to better capture the underlying trends and seasonality in our sales data. This improved our forecast accuracy by 15%, minimizing inventory holding costs and reducing stockouts.
Q 25. How do you stay updated on best practices in operations planning and forecasting?
Staying updated on best practices is paramount in this rapidly evolving field. I actively participate in industry conferences and webinars, attending events organized by organizations like APICS (The Association for Operations Management) and attending professional development courses. This allows me to stay abreast of the latest technologies, methodologies, and industry trends.
I also subscribe to relevant industry publications and journals, such as the Journal of Operations Management and Production and Operations Management. Reading research papers and case studies exposes me to innovative approaches and real-world applications. Networking with colleagues and peers through professional organizations and online forums provides valuable insights and different perspectives.
Q 26. Describe your experience with budget management and cost control within operations.
Budget management and cost control are integral to efficient operations. My experience involves developing and managing operational budgets, tracking expenses, and identifying areas for cost reduction. This includes analyzing cost drivers, negotiating with suppliers, and implementing cost-saving initiatives.
For example, in a previous role, we successfully reduced production costs by 10% by optimizing the use of raw materials through process improvements and waste reduction. This involved implementing lean manufacturing principles, such as Kaizen, and investing in new equipment with higher efficiency. Regular monitoring of key performance indicators (KPIs) like material costs, labor costs, and production efficiency helps in tracking progress and identifying deviations from the budget.
I also utilize cost accounting techniques, like Activity-Based Costing (ABC), to accurately allocate costs to different products and processes, enabling data-driven decisions on pricing and product mix.
Q 27. Explain your approach to identifying and resolving bottlenecks in your operations.
Identifying and resolving bottlenecks is critical for optimizing operational efficiency. My approach involves a systematic process: Firstly, I use data analysis to identify the constraints. This may involve analyzing production times, machine utilization, or inventory levels. Tools like Value Stream Mapping are valuable in visualizing the flow of materials and identifying bottlenecks visually.
Once the bottleneck is identified, I analyze the root cause. Is it due to insufficient machine capacity, inefficient processes, or material shortages? This requires a thorough investigation and may involve discussions with operators and supervisors on the production floor.
Finally, I develop and implement solutions to address the bottleneck. Solutions might involve investing in new equipment, improving process efficiency, or adjusting scheduling practices. For example, in one case, a bottleneck was caused by a slow machine. We addressed this by implementing a preventive maintenance program and investing in a faster, more efficient replacement machine. Continuous monitoring ensures the solution’s effectiveness and allows for further improvements.
Q 28. How do you measure and improve the efficiency of your supply chain?
Measuring and improving supply chain efficiency involves tracking various KPIs. Lead time (the time it takes to get a product from order to delivery), inventory turnover (how quickly inventory is sold), and on-time delivery are crucial metrics. I use these metrics to assess the overall health and efficiency of the supply chain.
Improvements involve strategies such as supplier relationship management (SRM) to foster collaboration and build strong relationships with key suppliers. Inventory optimization techniques, such as Just-in-Time (JIT) inventory management, help reduce inventory holding costs and improve responsiveness to demand fluctuations. Technology plays a key role; implementing supply chain management (SCM) software provides real-time visibility into inventory levels, transportation, and order status, enabling faster response to disruptions and improved coordination among different supply chain partners.
For example, implementing a robust transportation management system (TMS) helped us optimize delivery routes, reduce transportation costs, and improve on-time delivery rates. Regularly reviewing these metrics and implementing corrective actions are essential to maintain a high level of supply chain efficiency.
Key Topics to Learn for Operations Planning and Forecasting Interview
- Demand Forecasting Techniques: Explore various methods like time series analysis, causal modeling, and qualitative forecasting. Understand their strengths, weaknesses, and appropriate applications in different business contexts. Consider practical exercises using sample datasets.
- Capacity Planning: Learn how to align production capacity with forecasted demand, considering factors like equipment utilization, workforce availability, and potential bottlenecks. Practice scenarios involving resource allocation and optimization.
- Inventory Management: Master inventory control strategies, including EOQ (Economic Order Quantity), safety stock calculations, and just-in-time (JIT) inventory systems. Understand the trade-offs between inventory holding costs and stockout risks.
- Supply Chain Optimization: Examine the interconnectedness of different stages within the supply chain and how effective planning impacts overall efficiency and cost. Explore strategies for mitigating supply chain disruptions.
- Sales and Operations Planning (S&OP): Understand the process of integrating sales forecasts with operational plans to achieve alignment between supply and demand. Practice developing S&OP processes and identifying potential areas for improvement.
- Data Analysis & Reporting: Develop proficiency in analyzing operational data, identifying trends, and presenting findings clearly and concisely using appropriate visualizations (charts, graphs, dashboards). Consider different KPI’s (Key Performance Indicators) relevant to operations planning.
- Software and Tools: Familiarize yourself with common software used in operations planning and forecasting, such as ERP systems, demand planning software, and spreadsheet applications like Excel.
- Problem-Solving & Critical Thinking: Practice applying your knowledge to real-world scenarios. Focus on identifying problems, developing solutions, and evaluating potential outcomes. Consider case studies and simulations.
Next Steps
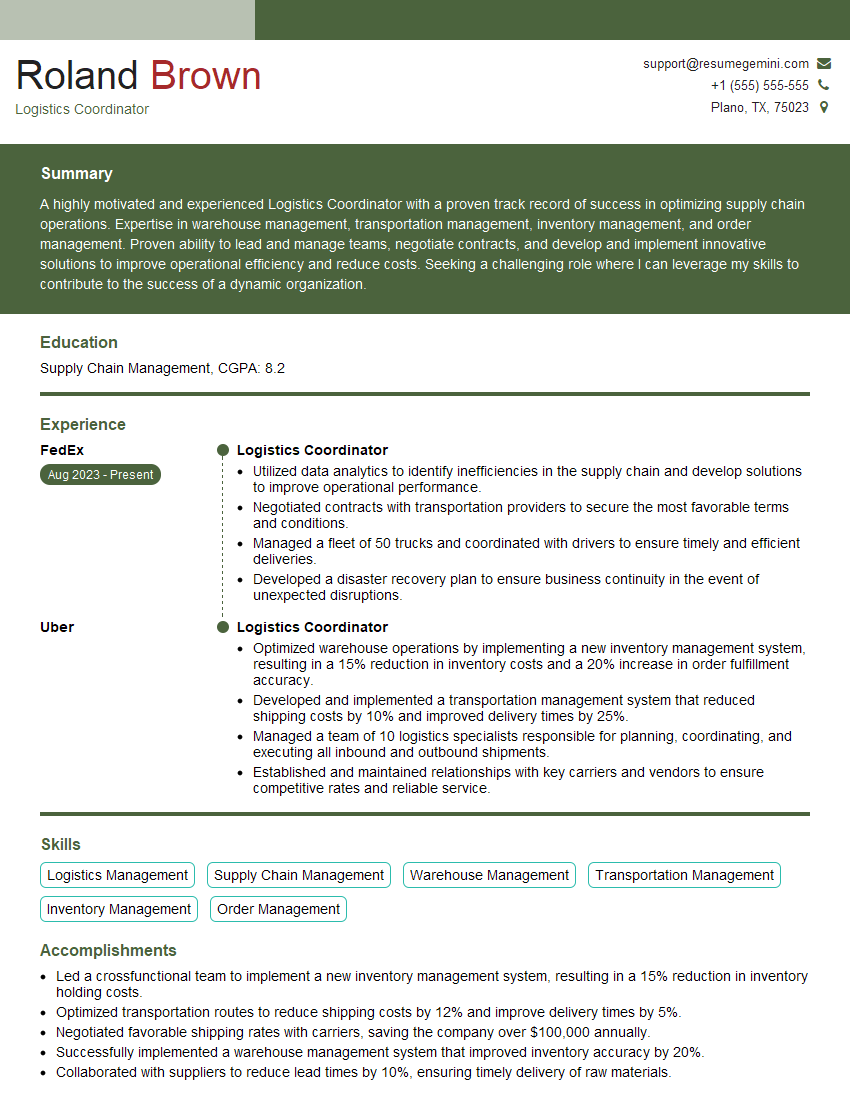
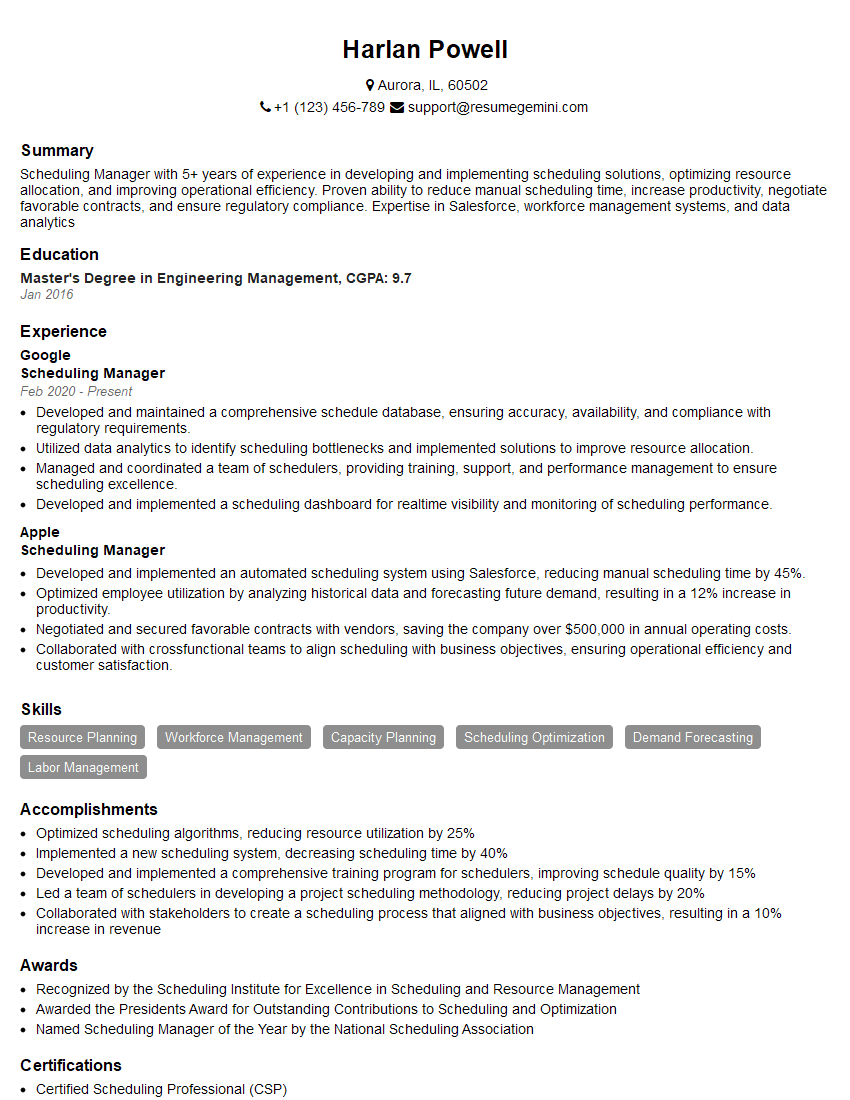
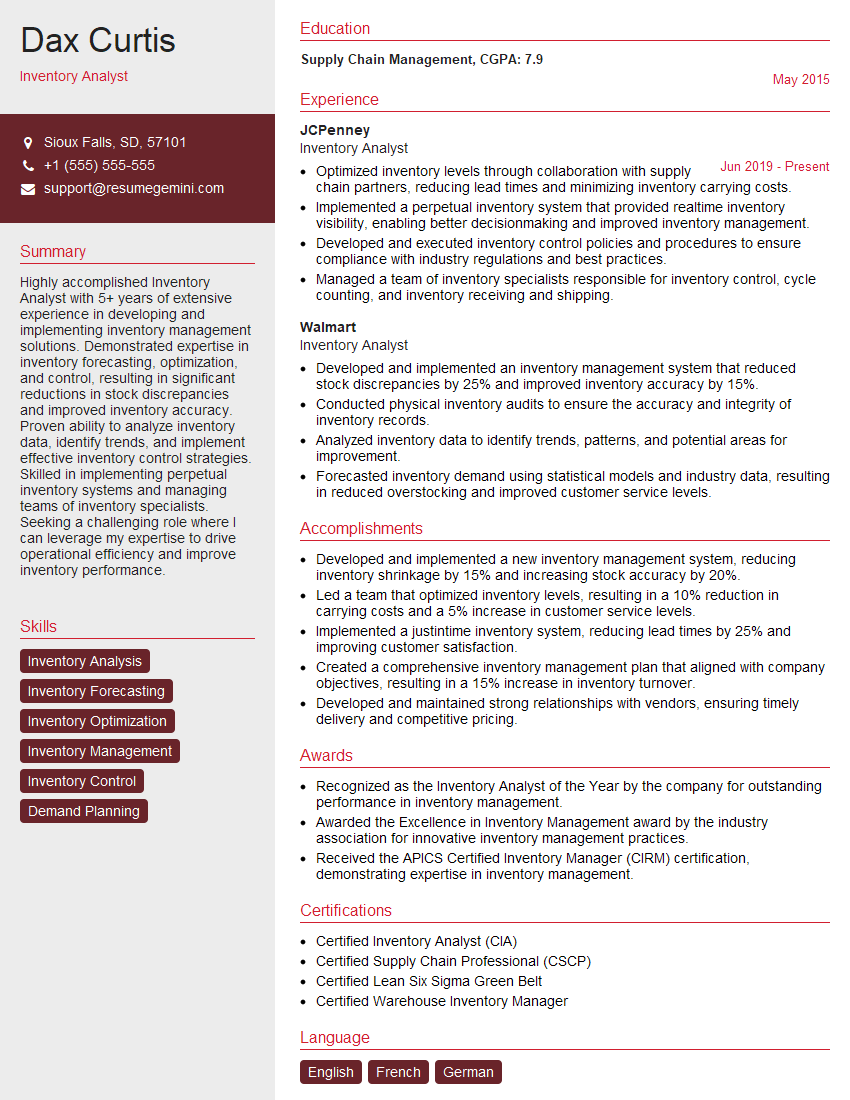
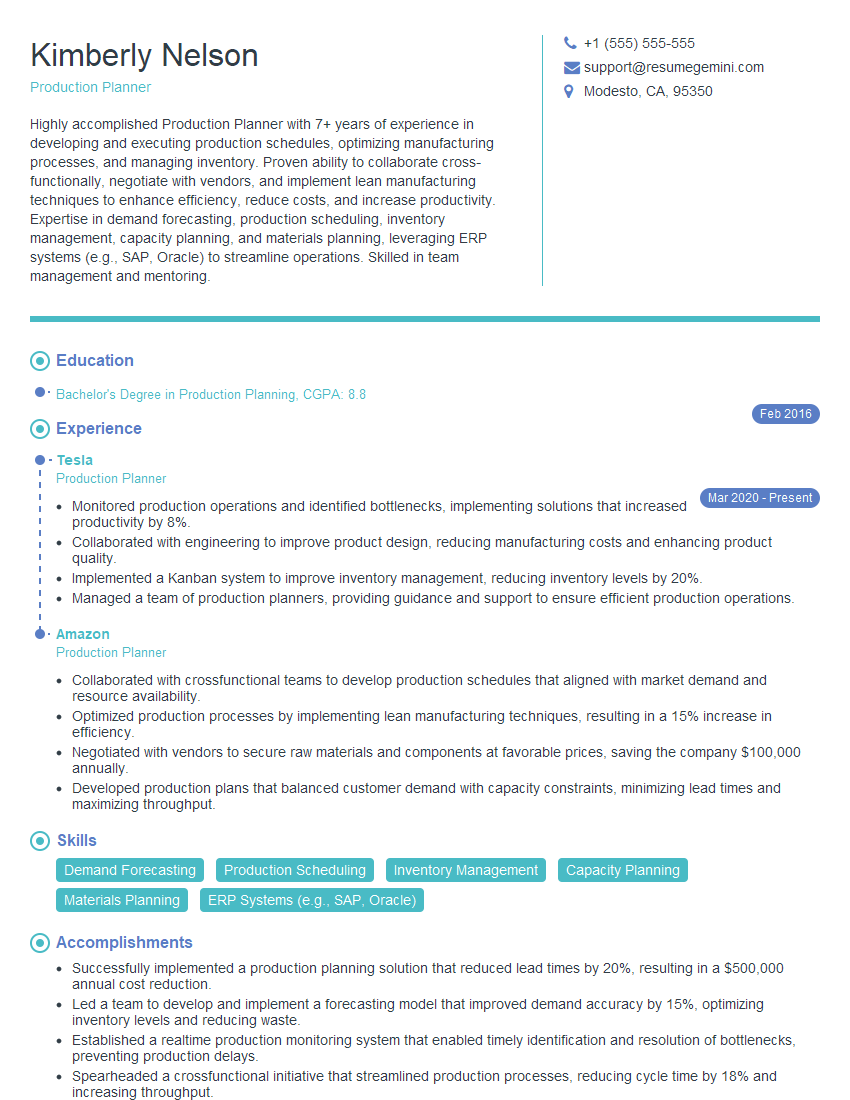
Mastering Operations Planning and Forecasting opens doors to exciting career opportunities with significant growth potential. It demonstrates valuable analytical and problem-solving skills highly sought after by employers. To significantly boost your job prospects, creating an ATS-friendly resume is crucial. This ensures your application gets noticed by Applicant Tracking Systems. We highly recommend using ResumeGemini, a trusted resource for building professional and impactful resumes. ResumeGemini provides examples of resumes tailored to Operations Planning and Forecasting roles, helping you present your qualifications effectively.
Explore more articles
Users Rating of Our Blogs
Share Your Experience
We value your feedback! Please rate our content and share your thoughts (optional).
What Readers Say About Our Blog
Hi, I represent an SEO company that specialises in getting you AI citations and higher rankings on Google. I’d like to offer you a 100% free SEO audit for your website. Would you be interested?
Dear Sir/Madam,
Do you want to become a vendor/supplier/service provider of Delta Air Lines, Inc.? We are looking for a reliable, innovative and fair partner for 2025/2026 series tender projects, tasks and contracts. Kindly indicate your interest by requesting a pre-qualification questionnaire. With this information, we will analyze whether you meet the minimum requirements to collaborate with us.
Best regards,
Carey Richardson
V.P. – Corporate Audit and Enterprise Risk Management
Delta Air Lines Inc
Group Procurement & Contracts Center
1030 Delta Boulevard,
Atlanta, GA 30354-1989
United States
+1(470) 982-2456

