Feeling uncertain about what to expect in your upcoming interview? We’ve got you covered! This blog highlights the most important Gene Expression Analysis and Regulation interview questions and provides actionable advice to help you stand out as the ideal candidate. Let’s pave the way for your success.
Questions Asked in Gene Expression Analysis and Regulation Interview
Q 1. Explain the central dogma of molecular biology.
The central dogma of molecular biology describes the flow of genetic information within a biological system. It’s a fundamental principle stating that information flows from DNA to RNA to protein. Think of it like this: DNA holds the master blueprint, RNA acts as a working copy, and proteins are the functional machines built according to those instructions.
- DNA Replication: DNA duplicates itself to pass on genetic information during cell division. This ensures each new cell receives a complete set of genetic instructions.
- Transcription: The DNA sequence is transcribed into messenger RNA (mRNA). This is like making a photocopy of a specific section of the blueprint.
- Translation: The mRNA sequence is translated into a protein. This is like using the photocopy to build the actual machine.
While this is a simplified model, it’s crucial to remember exceptions exist, such as reverse transcription in retroviruses, where RNA is used as a template to synthesize DNA.
Q 2. Describe the different levels of gene regulation.
Gene regulation is a complex process controlling which genes are expressed and at what level. It’s essential for cellular function, ensuring the right proteins are produced at the right time and in the right amounts. This regulation occurs at multiple levels:
- Epigenetic Regulation: This affects DNA accessibility without altering the DNA sequence itself. Think of it as adding notes or sticky flags to the blueprint, making certain parts easier or harder to access. Examples include DNA methylation and histone modification.
- Transcriptional Regulation: This controls the rate of transcription, the process of creating mRNA from DNA. This is like controlling the speed at which photocopies are made. Transcription factors, promoter regions, and enhancers play crucial roles.
- Post-transcriptional Regulation: This governs the processing, stability, and transport of mRNA. This is like controlling how the photocopies are handled, whether they’re stored, altered, or destroyed.
- Translational Regulation: This regulates the rate of protein synthesis from mRNA. This is like controlling the speed of the assembly line that builds the machines.
- Post-translational Regulation: This involves modifications to proteins after synthesis, affecting their activity or stability. This is like tweaking or maintaining the machines after they’re built. Examples include protein folding, phosphorylation, and ubiquitination.
Q 3. What are the key techniques used in gene expression analysis?
Several key techniques are employed in gene expression analysis. The choice depends on the research question, budget, and available resources.
- Microarrays: These use labeled cDNA or cRNA to hybridize to DNA probes on a chip, allowing for the simultaneous measurement of thousands of genes. Imagine it like a fingerprint scanner for genes.
- Quantitative PCR (qPCR): This highly sensitive technique measures the abundance of specific mRNA molecules using fluorescent probes. It’s like precisely counting the number of copies of a specific photocopy.
- RNA Sequencing (RNA-Seq): This method sequences the entire transcriptome, providing a comprehensive view of gene expression. This is like getting a complete digital image of all photocopies made, including variations.
- In situ hybridization (ISH): This technique allows the visualization of gene expression within tissues or cells. It’s like seeing where the photocopies are being used or stored.
- Reporter gene assays: These involve inserting a reporter gene into a gene regulatory region, allowing monitoring of gene expression. This is like adding a tracking device to see the activity of a specific part of the blueprint.
Q 4. Compare and contrast different methods for quantifying gene expression (e.g., qPCR, microarrays, RNA-Seq).
qPCR, microarrays, and RNA-Seq are all powerful tools for quantifying gene expression, but they have distinct strengths and weaknesses:
- qPCR: Highly sensitive and precise for measuring the expression of specific genes. However, it’s limited to a relatively small number of genes at a time.
- Microarrays: Allows simultaneous measurement of thousands of genes. However, its sensitivity is lower than qPCR, and it’s limited to the genes represented on the array.
- RNA-Seq: Provides the most comprehensive view of gene expression, including detection of novel transcripts and isoforms. It’s also highly sensitive. However, it’s more expensive and computationally intensive than qPCR or microarrays.
In short: qPCR is like a precise ruler for specific measurements, microarrays are like a broad overview map, and RNA-Seq is like a highly detailed satellite image.
Q 5. How is RNA-Seq data analyzed and interpreted?
RNA-Seq data analysis is a multi-step process. First, raw sequencing reads need to be processed to remove low-quality reads and adapters. Then, reads are aligned to a reference genome to quantify gene expression. This involves counting the number of reads that map to each gene.
After alignment, normalization is crucial to account for differences in sequencing depth and library size. Differential expression analysis is performed to identify genes showing significant changes in expression between different conditions. This often involves statistical testing to determine which differences are biologically meaningful, not just random noise.
Finally, the results are visualized and interpreted, often using heatmaps, volcano plots, and gene ontology enrichment analysis to understand the biological processes affected by changes in gene expression. For example, if you’re studying a disease, you might identify upregulated immune response genes, offering insights into the disease mechanism.
Q 6. What are the common normalization methods used in RNA-Seq data analysis?
Normalization in RNA-Seq is essential to ensure accurate comparison of gene expression levels between samples. Different normalization methods address different biases:
- Total count normalization (TPM, RPKM/FPKM): This normalizes for differences in sequencing depth by dividing the read counts by the total number of reads in the sample. This is like adjusting for the number of photocopies made.
- Upper quartile normalization: This normalizes for differences in library size by using the upper quartile of read counts across samples. This is like adjusting for differences in the handling of photocopies.
- DESeq2 and edgeR methods: These are more sophisticated methods that account for both sequencing depth and other technical biases using statistical models. They are more sophisticated than the previous ones, taking into account more factors.
The choice of normalization method depends on the experimental design and data characteristics. It’s crucial to choose a method appropriate for the research question to avoid misinterpreting results.
Q 7. Describe the concept of differential gene expression.
Differential gene expression refers to changes in the expression levels of genes between different conditions or samples. This is a fundamental concept in many areas of biological research, like disease studies, developmental biology, and drug discovery. For instance, comparing gene expression in cancerous cells versus healthy cells can reveal genes involved in cancer development.
Identifying differentially expressed genes involves statistical analysis of RNA-Seq or microarray data. The goal is to determine if observed differences in gene expression are statistically significant, indicating a true biological difference rather than random variation. Tools like DESeq2 and edgeR are frequently used for this purpose.
The analysis usually provides a list of genes with adjusted p-values and fold changes, indicating the statistical significance and magnitude of the expression change. Further analysis, including pathway enrichment analysis, can provide valuable insights into the biological processes impacted by these expression changes.
Q 8. How do you identify differentially expressed genes using statistical methods?
Identifying differentially expressed genes (DEGs) involves comparing gene expression levels across different experimental conditions (e.g., treated vs. untreated cells, different tissues). We employ statistical methods to determine if the observed differences are significant and not due to random chance. The most common approach uses a t-test or similar statistical tests, especially when dealing with two groups. For multiple groups, ANOVA is frequently used. These tests compare the means of gene expression levels between groups. However, simply identifying statistical significance is not enough. We need to adjust for multiple testing to account for the fact that we’re performing thousands of tests simultaneously (one for each gene). Methods like the Benjamini-Hochberg procedure control the false discovery rate (FDR), minimizing the chance of incorrectly identifying genes as differentially expressed. Finally, we typically set a threshold for both the p-value (indicating statistical significance) and the fold change (measuring the magnitude of the difference in expression) to filter for biologically meaningful DEGs. For example, we might only consider genes with a p-value < 0.05 and a fold change > 2 as truly differentially expressed.
In practice, I often use R packages like edgeR or DESeq2, which incorporate these statistical methods and multiple testing corrections, simplifying the analysis pipeline. These tools also provide visualizations, such as volcano plots, to readily identify significant DEGs.
Q 9. Explain the concept of pathway analysis and its significance in gene expression studies.
Pathway analysis takes the list of DEGs identified in a gene expression study and examines them within the context of known biological pathways. It essentially asks: “Which biological pathways are significantly enriched among the DEGs?” This is important because genes don’t function in isolation; they interact within complex networks. Identifying enriched pathways provides insights into the biological processes affected by the experimental manipulation. For instance, if a study on a new drug reveals many genes involved in cell cycle regulation are downregulated, pathway analysis can confirm that the drug may be interfering with cell growth.
Tools like DAVID, GOseq, and ReactomePA use enrichment analysis to compare the number of DEGs found in a specific pathway against the number expected by chance. They report a p-value indicating the statistical significance of enrichment. Understanding which pathways are affected is crucial for interpreting the broader biological implications of the gene expression changes. It helps move beyond a simple list of DEGs to a more comprehensive understanding of the underlying biological mechanisms.
Q 10. What are the ethical considerations involved in gene expression research?
Ethical considerations in gene expression research are paramount. Privacy and confidentiality of participants are critical, especially when dealing with human subjects. Data must be anonymized and securely stored to protect individual identities. Informed consent is essential, ensuring participants understand the study’s purpose, procedures, risks, and benefits before participating. Furthermore, the potential for misuse of gene expression data, for example, in genetic discrimination, needs careful consideration. Research involving human genetic information should adhere to strict ethical guidelines and regulations, such as those set by institutional review boards (IRBs) and relevant national or international authorities. Responsible data management and sharing practices are crucial to ensure that the potential benefits of gene expression research are realized while minimizing potential harms. For example, if the research could lead to personalized medicine approaches, it’s crucial to consider equitable access to any resulting treatments or interventions.
Q 11. Describe your experience with bioinformatics tools for analyzing gene expression data.
My experience with bioinformatics tools for analyzing gene expression data is extensive. I’m proficient in using several popular platforms and packages. This includes R and its associated packages like edgeR, DESeq2, limma (for linear modeling of microarray data), and ggplot2 for creating high-quality visualizations. I’m also experienced in using Python with libraries such as pandas, scipy, and scikit-learn for data manipulation, statistical analysis, and machine learning applications. I’ve utilized various pathway analysis tools, such as DAVID, GOseq, and ReactomePA, to gain biological insights from gene expression data. Additionally, I have experience working with genomic databases, such as Gene Expression Omnibus (GEO) and ArrayExpress, to access and analyze publicly available datasets. Furthermore, I’m comfortable using command-line tools for data preprocessing and quality control. My skills extend to using specialized software like Partek Genomics Suite for microarray data analysis.
Q 12. How would you troubleshoot issues with low RNA yield in an experiment?
Low RNA yield in an experiment is a common problem. Troubleshooting requires a systematic approach, checking each step of the RNA extraction process. First, I’d review the RNA extraction protocol. Were all steps followed precisely? Errors in reagent volumes or incubation times can significantly impact yield. Second, I’d assess the quality of the starting material. Was sufficient tissue or cells used? Was the tissue properly stored and handled to prevent RNA degradation? RNA degradation is a major cause of low yield. Checking RNA integrity using an Agilent Bioanalyzer or similar tool is crucial. Third, I’d examine the efficiency of the RNA isolation method itself. Contaminants in the starting material can inhibit RNA extraction. If the yield remains low despite addressing these issues, I might consider using an alternative RNA extraction method, possibly one specifically designed for the type of sample being used. In cases where the initial material is limited, RNA amplification techniques could also be explored. Finally, maintaining meticulous lab notes throughout the entire process is crucial for identifying and rectifying the source of the issue.
Q 13. Explain the concept of epigenetic modifications and their role in gene expression.
Epigenetic modifications are heritable changes in gene expression that do *not* involve alterations to the underlying DNA sequence. They act as a layer of control on top of the genetic code, influencing which genes are turned on or off. Key mechanisms include DNA methylation (addition of a methyl group to cytosine bases), histone modification (chemical changes to histone proteins around which DNA is wrapped), and non-coding RNA-mediated gene silencing. DNA methylation typically represses gene expression, while histone modifications can either activate or repress it depending on the type of modification. For example, histone acetylation generally promotes gene expression, whereas histone methylation can have varied effects depending on the specific amino acid residue modified. Epigenetic modifications play crucial roles in development, cell differentiation, and disease. Changes in epigenetic patterns can contribute to cancer, neurodevelopmental disorders, and other conditions. Understanding epigenetic mechanisms is critical for developing new therapeutic strategies that target gene expression without altering the DNA sequence itself. For instance, drugs inhibiting DNA methyltransferases or histone deacetylases are already used in cancer therapy.
Q 14. Discuss the role of non-coding RNAs in gene regulation.
Non-coding RNAs (ncRNAs) are RNA molecules that are not translated into proteins but play vital roles in gene regulation. They represent a diverse group of molecules with varying functions. MicroRNAs (miRNAs) are small ncRNAs that bind to messenger RNAs (mRNAs), leading to either mRNA degradation or translational repression, effectively silencing the target gene. Long non-coding RNAs (lncRNAs) are longer than 200 nucleotides and can interact with DNA, RNA, or proteins to influence gene expression, often in a tissue- or cell-specific manner. For example, some lncRNAs can act as scaffolds, bringing together other regulatory molecules, while others may act as guides for epigenetic modifications. Other ncRNAs like small interfering RNAs (siRNAs) and Piwi-interacting RNAs (piRNAs) also contribute to gene silencing through different mechanisms. The discovery and study of ncRNAs have significantly expanded our understanding of the complexity of gene regulation, revealing that much more than protein-coding genes are involved in shaping cellular functions and phenotypes. For example, improper regulation of miRNAs has been implicated in various cancers.
Q 15. What are the applications of gene expression analysis in drug discovery?
Gene expression analysis plays a crucial role in drug discovery by identifying potential drug targets and assessing the efficacy and safety of new drugs. We can analyze changes in gene expression in response to drug treatment to understand how a drug affects cellular processes. This helps in identifying biomarkers for predicting drug response and toxicity.
- Target Identification: By comparing gene expression profiles between healthy and diseased cells, we can pinpoint genes that are differentially expressed, potentially representing key players in the disease mechanism. These genes can then be targeted with new drugs.
- Drug Efficacy and Safety: We can monitor gene expression changes in preclinical studies (using cell lines or animal models) to determine if a drug is effective and to identify potential side effects. For instance, a drug might induce the expression of genes associated with liver toxicity, providing a warning sign.
- Biomarker Discovery: Gene expression signatures can be used to identify biomarkers that predict a patient’s response to a drug. This allows for personalized medicine approaches, tailoring treatment based on individual genetic profiles.
For example, in cancer research, gene expression profiling can help identify cancer-specific genes that can serve as targets for new cancer therapies. Similarly, in infectious disease research, it can help understand how pathogens affect host gene expression and potentially lead to the discovery of new antiviral or antibacterial drugs.
Career Expert Tips:
- Ace those interviews! Prepare effectively by reviewing the Top 50 Most Common Interview Questions on ResumeGemini.
- Navigate your job search with confidence! Explore a wide range of Career Tips on ResumeGemini. Learn about common challenges and recommendations to overcome them.
- Craft the perfect resume! Master the Art of Resume Writing with ResumeGemini’s guide. Showcase your unique qualifications and achievements effectively.
- Don’t miss out on holiday savings! Build your dream resume with ResumeGemini’s ATS optimized templates.
Q 16. How can gene expression analysis be used to study disease mechanisms?
Gene expression analysis is a powerful tool for dissecting disease mechanisms. By comparing gene expression profiles between healthy and diseased tissues or cells, we can identify genes whose expression levels are significantly altered in the disease state. These genes often play key roles in the disease process.
- Identifying Disease Pathways: Analyzing the altered expression of genes involved in specific pathways (e.g., cell signaling, metabolism, apoptosis) reveals how these pathways are disrupted in disease. For example, upregulation of genes promoting cell growth and proliferation might indicate uncontrolled cell growth characteristic of cancer.
- Understanding Disease Progression: Monitoring gene expression changes over time can help us understand how a disease progresses. We can observe which genes are involved in early stages of the disease, offering potential early diagnostic markers.
- Identifying Disease Subtypes: Gene expression profiling can help classify diseases into subtypes based on their unique molecular signatures. This is particularly useful in cancer, where tumors can exhibit diverse genetic profiles, affecting their response to therapy.
Imagine studying Alzheimer’s disease. We can compare gene expression in the brains of Alzheimer’s patients with healthy controls. By identifying genes upregulated in Alzheimer’s brains, we gain insights into the molecular processes underlying the disease, like amyloid plaque formation or neuronal dysfunction. This can guide the development of targeted therapies.
Q 17. What are the advantages and limitations of using microarrays for gene expression analysis?
Microarrays were a pioneering technology in gene expression analysis, but now next-generation sequencing (NGS) is the dominant technique. Microarrays offer certain advantages and limitations compared to NGS.
- Advantages:
- Relatively inexpensive: Microarrays were generally cheaper than early NGS technologies, though this gap is narrowing.
- Established technology: Mature technology with extensive data analysis pipelines available.
- Well-defined platforms: Consistent and reproducible results between platforms (Affymetrix, Illumina).
- Limitations:
- Pre-defined probes: Limited to genes present on the microarray chip, potentially missing novel transcripts or isoforms.
- Lower sensitivity and dynamic range: Not as sensitive as NGS, particularly for low-abundance transcripts.
- Cross-hybridization: Potential for non-specific binding, especially in highly homologous gene families.
In summary, while microarrays remain useful for specific applications, NGS technologies have largely replaced them for their superior sensitivity, broader coverage, and ability to discover novel transcripts.
Q 18. Explain the difference between expression and regulation.
Gene expression refers to the process by which information encoded in a gene is used to synthesize a functional gene product, usually a protein. Gene regulation, on the other hand, encompasses the intricate mechanisms that control the timing, location, and amount of gene expression. It’s like the difference between building a house (expression) and controlling the budget, schedule, and materials used in the construction (regulation).
Expression: This is the observable outcome – the levels of mRNA transcripts or the amount of protein produced from a gene. We measure this using techniques like qPCR, microarrays, or RNA sequencing.
Regulation: This involves a complex interplay of factors, including:
- Transcriptional regulation: Control of the initiation of transcription (RNA synthesis) by transcription factors binding to promoter regions of genes.
- Post-transcriptional regulation: Processes affecting mRNA stability, splicing, and translation.
- Epigenetic regulation: Modification of DNA or histones that affect gene accessibility.
- Post-translational regulation: Modification of proteins after synthesis, influencing their activity or stability.
Understanding both gene expression and regulation is crucial because altered regulation often underlies many diseases, even if the gene itself is not mutated.
Q 19. Describe your experience with specific gene expression platforms (e.g., Affymetrix, Illumina).
I have extensive experience with both Affymetrix and Illumina platforms for gene expression analysis. My work with Affymetrix GeneChips involved using their robust hybridization-based technology for analyzing gene expression in various biological samples. I was involved in projects comparing gene expression across different disease states and in response to drug treatments. Data analysis focused on robust statistical methods such as RMA (Robust Multichip Average) normalization and differential expression analysis using tools like LIMMA.
With Illumina platforms (e.g., BeadChips and RNA sequencing), I’ve utilized both their microarray and NGS capabilities. Illumina’s platforms are known for their high throughput and accuracy. I have experience with both the experimental design aspects and the bioinformatic analyses associated with these platforms, including data quality control, alignment (for NGS), and differential expression analysis using tools such as DESeq2 and edgeR.
In both cases, my work has involved meticulous experimental design, stringent quality control, and rigorous statistical analysis to ensure the reliability and validity of the gene expression data.
Q 20. How do you validate gene expression results?
Validating gene expression results is critical to ensure their reliability and biological significance. This is usually a multi-step process:
- Technical Validation: This focuses on the quality of the experiment and data. It includes checking for technical artifacts, appropriate normalization methods, and the reproducibility of results across replicates.
- Biological Validation: This assesses whether the observed gene expression changes are biologically meaningful. Common methods include:
- Quantitative PCR (qPCR): This highly sensitive technique allows for the independent validation of gene expression changes identified in a microarray or RNA-seq experiment. It’s essential to validate a representative subset of genes, including both up-regulated and down-regulated ones.
- Western blotting or ELISA: These methods measure protein levels, providing a direct assessment of the functional consequences of altered gene expression. It’s important to note that mRNA expression does not always directly correlate with protein levels.
- Functional assays: These experiments investigate the functional role of the identified genes in the biological process of interest. For example, if a gene involved in cell proliferation is up-regulated, a functional assay like a cell proliferation assay could confirm its contribution to increased cell growth.
Choosing appropriate validation methods depends on the research question and the available resources. Combining multiple validation techniques strengthens the conclusions.
Q 21. How would you interpret a volcano plot showing differential gene expression?
A volcano plot is a powerful visualization tool used in differential gene expression analysis. It displays the statistical significance (p-value) and the magnitude of change (fold change) for each gene. The x-axis represents the log2 fold change (the difference in expression between two conditions), and the y-axis represents the negative log10 p-value (a measure of statistical significance).
Interpretation:
- Genes in the upper left quadrant: These genes are significantly down-regulated (log2 fold change < 0) and have a low p-value (high negative log10 p-value).
- Genes in the upper right quadrant: These genes are significantly up-regulated (log2 fold change > 0) and have a low p-value.
- Genes close to the x-axis: These genes show little or no change in expression levels between the two conditions.
- Genes close to the y-axis: These genes have p-values that are not statistically significant, regardless of their fold change.
The volcano plot helps to identify genes that are both statistically significant and exhibit substantial changes in expression, making it easy to pinpoint the key genes driving the differences observed between the experimental conditions. Often, a cutoff is applied to the p-value and fold change to select only the most relevant genes for further investigation.
Q 22. Discuss the challenges in analyzing gene expression data from complex samples.
Analyzing gene expression data from complex samples, like a tumor biopsy containing diverse cell types, presents several significant challenges. The primary issue is heterogeneity: the sample isn’t uniform; it contains a mixture of cells with varying gene expression profiles. This makes it difficult to isolate the signal of interest from the noise of the background.
- Deconvolution: Separating the gene expression signals of individual cell types within a mixed sample is computationally challenging and often requires sophisticated algorithms and prior knowledge about the cell types present. Imagine trying to separate the individual notes played by different instruments in an orchestra recording – the sounds overlap significantly, much like the gene expression in mixed samples.
- Technical noise: The process of extracting RNA and performing measurements introduces noise. Different batches of reagents, variability in the RNA extraction, and the sequencing itself all contribute to variability in gene expression data. Careful experimental design and normalization techniques help to mitigate this.
- Normalization: Correctly normalizing the data is critical to account for differences in sequencing depth and other technical artifacts. This often involves complex statistical approaches to ensure accurate comparisons between samples.
- Data dimensionality: Gene expression datasets often contain thousands of genes, resulting in high-dimensional data that requires sophisticated dimensionality reduction techniques (like PCA) before meaningful analysis can be performed.
Overcoming these challenges requires a combination of advanced experimental techniques, rigorous data preprocessing, and robust statistical analysis. For example, single-cell RNA sequencing is a powerful tool to tackle heterogeneity by profiling gene expression in individual cells, avoiding the averaging effect of bulk samples.
Q 23. Explain your understanding of CRISPR-Cas9 technology and its applications in gene expression studies.
CRISPR-Cas9 is a revolutionary gene-editing technology. It uses a guide RNA (gRNA) to direct the Cas9 enzyme to a specific location in the genome, where it can create a double-stranded break. The cell then repairs this break, often through non-homologous end joining (NHEJ), which can lead to insertions or deletions (indels), disrupting gene function. Alternatively, a donor DNA template can be provided, enabling precise gene editing through homologous recombination.
In gene expression studies, CRISPR-Cas9 has several applications:
- Gene knockout: Disrupting a gene’s function to assess its impact on gene expression patterns of other genes. Imagine silencing a transcription factor to see how its target genes are affected.
- Gene activation: Using modified CRISPR-Cas9 systems (like CRISPRa) to increase the expression of a specific gene and study its downstream effects.
- Epigenetic modification: Targeting epigenetic regulators using CRISPR-Cas9 to modify chromatin structure and thereby alter gene expression. This could involve targeting histone modifying enzymes or DNA methylation machinery.
- High-throughput screening: Using CRISPR-Cas9 to create a library of gene knockouts or edits to screen for genes involved in a specific process or phenotype. This allows scientists to unravel complex biological pathways.
The precision and versatility of CRISPR-Cas9 have greatly advanced our ability to manipulate and study gene expression, allowing for a more causal understanding of gene regulation.
Q 24. How would you design an experiment to investigate the effect of a specific treatment on gene expression?
Designing an experiment to investigate the effect of a specific treatment on gene expression requires careful planning. Here’s a structured approach:
- Define the research question: Clearly state the hypothesis and the specific genes or pathways you’re interested in. For example, “Does treatment X upregulate gene Y in cell line Z?”
- Choose appropriate experimental model: Select cell lines, animal models, or human samples relevant to your research question. Consider factors like accessibility, cost, and ethical considerations.
- Treatment design: Establish the control group (untreated) and treatment groups (receiving varying doses or durations of treatment X). Include biological replicates (multiple samples per group) to minimize experimental variation.
- Sample collection and RNA extraction: Decide on the time points at which you’ll collect samples to capture the dynamic changes in gene expression. Use appropriate RNA extraction methods to ensure high-quality RNA.
- Gene expression profiling: Choose a suitable gene expression profiling method: qPCR for a few specific genes or microarray/RNA-seq for a genome-wide assessment. RNA-seq provides more comprehensive information but is also more expensive.
- Data analysis: Plan the statistical analysis you will perform, including normalization, differential gene expression analysis, and pathway analysis. This will identify genes significantly altered by the treatment.
- Validation: Confirm findings using independent methods (e.g., Western blotting to validate protein levels). Consider functional assays (e.g., cell viability assays) to connect gene expression changes to cellular responses.
For instance, if studying the effect of a new drug on immune cell activation, you might treat immune cells in vitro with the drug and compare their gene expression profiles to untreated controls at various time points using RNA-Seq, followed by pathway analysis to understand the biological effects of the drug.
Q 25. Describe your experience with statistical software for gene expression analysis (e.g., R, Python).
I have extensive experience with both R and Python for gene expression analysis. R, with packages like edgeR, limma, and DESeq2, excels in handling RNA-Seq data and performing differential gene expression analysis. Its strengths lie in its statistical power and the vast collection of bioinformatics packages specifically designed for genomic data. For example, ggplot2 allows for highly customizable visualization of complex data.
Python, with libraries like pandas, scikit-learn, and Biopython, offers flexibility in data manipulation, machine learning applications, and integration with other bioinformatics tools. Its strengths lie in its versatile programming capabilities and the ease of interfacing with other software and databases.
Below is a small example of using R’s limma package for differential expression analysis:
library(limma)
# ... data loading and preprocessing ...
fit <- lmFit(eset, design)
fit <- eBayes(fit)
topTable(fit, coef=2, adjust='BH') # Results table after correction for multiple testing
I choose the appropriate tool based on the specific task and dataset. Often, I leverage the strengths of both languages in a combined workflow, taking advantage of R's specialized bioconductor packages and Python's broader utility.
Q 26. What are some common biases in gene expression data and how can they be addressed?
Gene expression data is prone to various biases that can lead to inaccurate interpretations. Addressing these biases is crucial for obtaining reliable results.
- Batch effects: Variations introduced by different experimental batches (different days, reagents, technicians). Normalization methods such as ComBat can help to correct for this.
- Library size bias (in RNA-Seq): Differences in the total number of reads sequenced per sample, leading to disproportionate representation of genes. Normalization methods like RPKM, TPM, and DESeq2's size factor normalization correct for this.
- GC content bias (in RNA-Seq): Genes with high GC content might be sequenced more or less efficiently than others, affecting their apparent expression levels. Specialized RNA-Seq alignment software and normalization methods address this.
- Sequence bias (in microarray): Differences in probe affinity can lead to systematic biases.
- RNA degradation bias: Degraded RNA can lead to underestimation of expression levels, particularly of longer transcripts. Careful RNA handling and quality control are critical.
Addressing these biases involves a combination of experimental design, appropriate data preprocessing, and statistical methods. Careful experimental design minimizes batch effects by processing samples from different conditions together. Using appropriate normalization methods ensures that technical variations are corrected for. Robust statistical methods, such as those that account for batch effects and other covariates, are crucial for interpreting the data accurately.
Q 27. Explain the concept of single-cell RNA sequencing and its applications.
Single-cell RNA sequencing (scRNA-seq) is a powerful technique that allows us to measure the gene expression profile of individual cells within a heterogeneous population. This is in contrast to traditional bulk RNA-Seq, which measures the average expression across many cells.
Its applications are wide-ranging:
- Cell type identification and characterization: Identifying different cell types within a tissue or organ based on their unique gene expression signatures. This is like sorting cells using their genetic fingerprint.
- Developmental biology: Tracking changes in gene expression during development, revealing cellular lineage and differentiation processes. Think of following the progression of a single stem cell to its specialized daughter cells.
- Cancer biology: Characterizing the heterogeneity of tumor cells, identifying cancer stem cells, and understanding tumor microenvironment interactions. This provides crucial information for targeted cancer therapies.
- Immunology: Analyzing the diversity and function of immune cells, identifying specific immune cell subtypes, and understanding immune responses. It helps us understand the intricate dance of immune cells during infection or autoimmune diseases.
- Neurobiology: Studying the diverse cell types of the brain, understanding neuronal development, and revealing circuit dynamics. This can shed light on neurological disorders.
While scRNA-seq provides invaluable insights, it also has limitations. The technique is expensive and requires specialized bioinformatics tools for data analysis due to the high dimensionality and sparsity of the data. However, advancements in technology and computational methods continually improve its accessibility and accuracy.
Key Topics to Learn for Gene Expression Analysis and Regulation Interview
- Transcriptional Regulation: Understanding promoters, enhancers, silencers, transcription factors, and their roles in controlling gene expression. Consider practical applications like designing CRISPR-based gene editing strategies.
- Post-Transcriptional Regulation: Mastering concepts like RNA splicing, mRNA stability, RNA interference (RNAi), and microRNAs (miRNAs). Think about how these processes are exploited in therapeutic development.
- Translational Regulation: Explore the mechanisms controlling protein synthesis initiation, elongation, and termination. Consider examples of how translational control impacts cellular responses to stress.
- Epigenetic Regulation: Familiarize yourself with DNA methylation, histone modifications, and their influence on gene expression. Discuss how epigenetic changes contribute to disease development and potential therapeutic interventions.
- Gene Expression Analysis Techniques: Gain proficiency in techniques such as qPCR, microarrays, RNA sequencing (RNA-Seq), and ChIP-seq. Be prepared to discuss the strengths and limitations of each method and their appropriate applications.
- Data Analysis and Interpretation: Develop skills in bioinformatics and statistical analysis for interpreting gene expression data. Practice visualizing and presenting complex datasets effectively.
- Problem-Solving Approaches: Prepare to discuss your approach to troubleshooting experiments, interpreting unexpected results, and designing future experiments to address research questions.
- Ethical Considerations: Familiarize yourself with the ethical implications of gene editing technologies and their potential impact on human health and society.
Next Steps
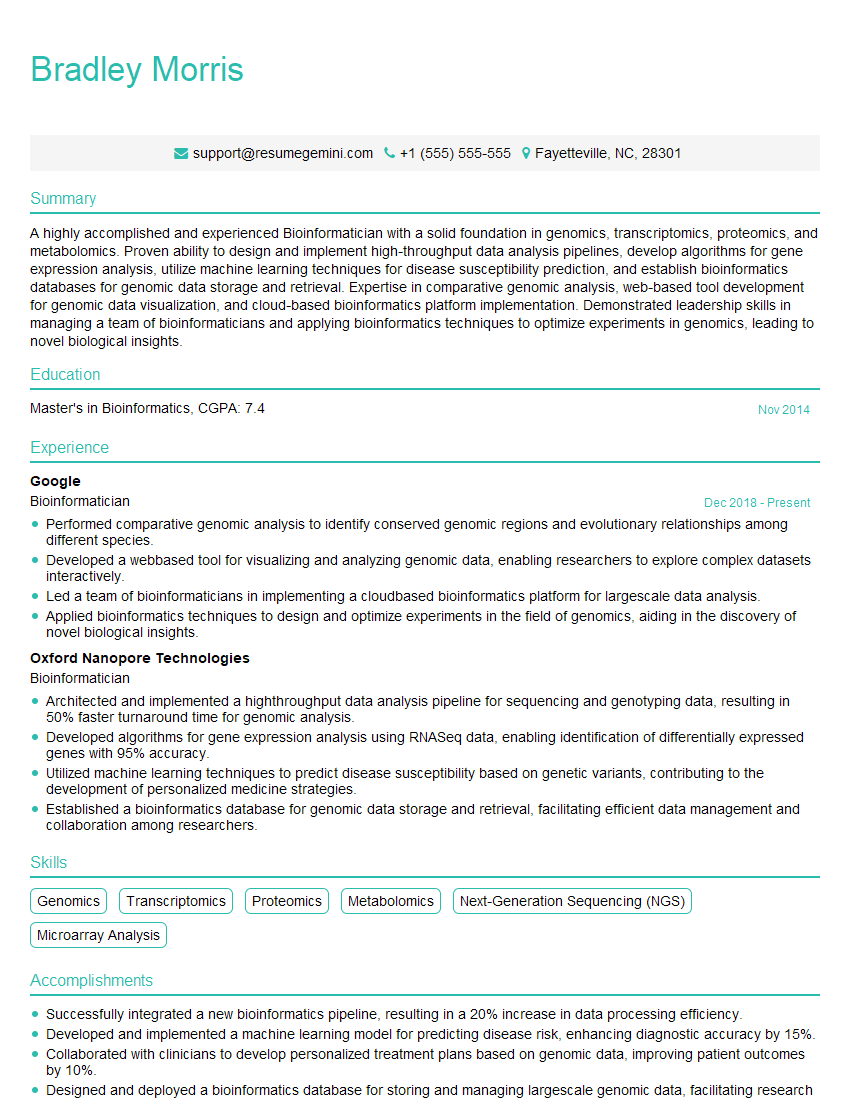
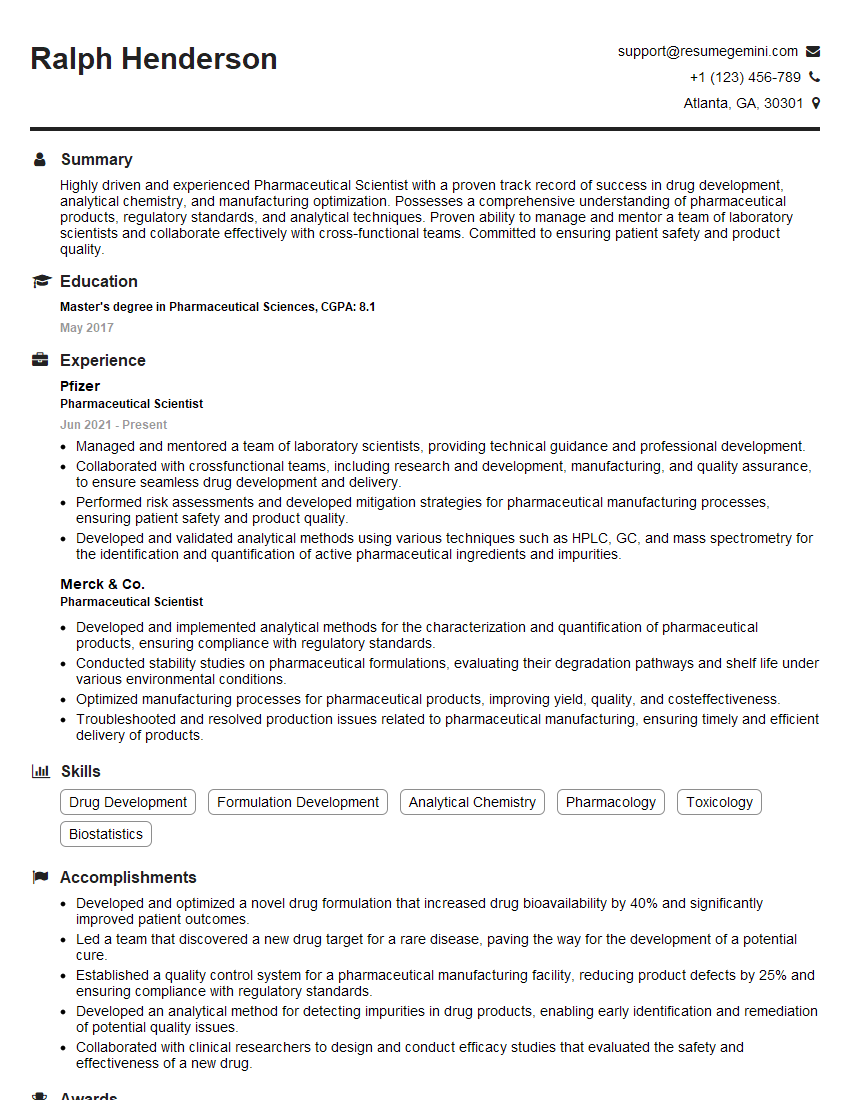
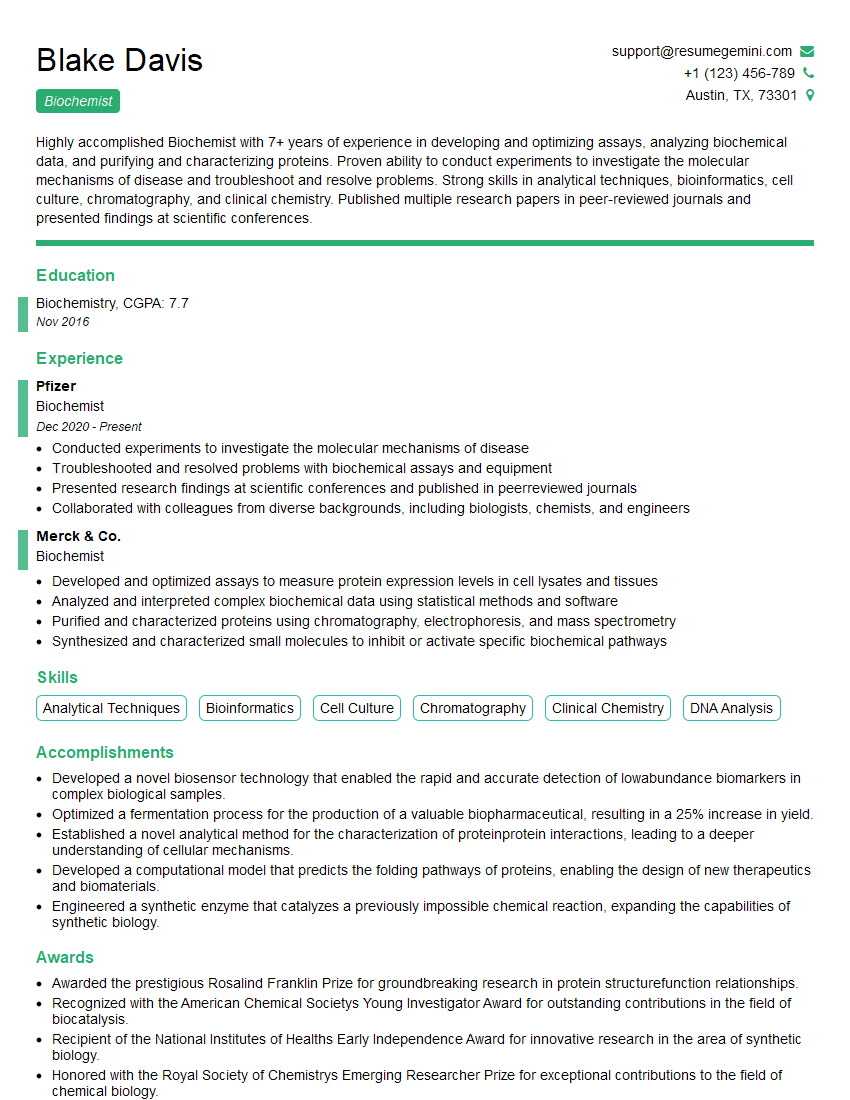
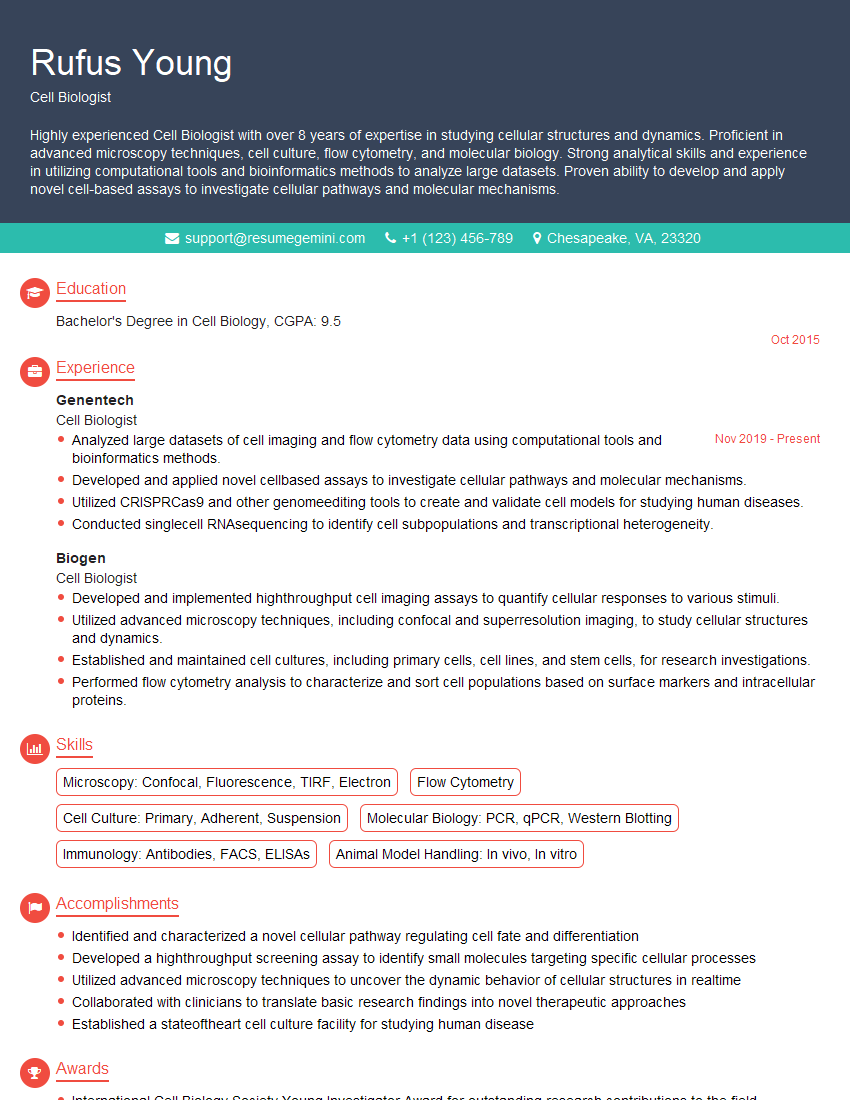
Mastering Gene Expression Analysis and Regulation opens doors to exciting careers in research, biotechnology, and pharmaceuticals. A strong understanding of these principles is crucial for success in these competitive fields. To significantly boost your job prospects, create an ATS-friendly resume that highlights your skills and experience effectively. ResumeGemini is a trusted resource to help you build a professional and impactful resume, tailored to your specific career goals. Examples of resumes tailored to Gene Expression Analysis and Regulation are available to further guide your resume creation process.
Explore more articles
Users Rating of Our Blogs
Share Your Experience
We value your feedback! Please rate our content and share your thoughts (optional).
What Readers Say About Our Blog
Interesting Article, I liked the depth of knowledge you’ve shared.
Helpful, thanks for sharing.
Hi, I represent a social media marketing agency and liked your blog
Hi, I represent an SEO company that specialises in getting you AI citations and higher rankings on Google. I’d like to offer you a 100% free SEO audit for your website. Would you be interested?
