Cracking a skill-specific interview, like one for Cloud Performance Engineering, requires understanding the nuances of the role. In this blog, we present the questions you’re most likely to encounter, along with insights into how to answer them effectively. Let’s ensure you’re ready to make a strong impression.
Questions Asked in Cloud Performance Engineering Interview
Q 1. Explain the difference between load testing, stress testing, and performance testing.
Performance testing is a broad umbrella term encompassing various techniques to evaluate the speed, scalability, and stability of a system. Load testing, stress testing, and performance testing are all types of performance testing but focus on different aspects.
Load Testing: Simulates realistic user load on a system to determine its behavior under expected conditions. Think of it like a busy workday – are there enough servers to handle the typical number of users?
Stress Testing: Pushes the system beyond its expected limits to identify breaking points and assess its resilience. This is like seeing how many users your system can handle before it crashes. We’re looking for failure points to improve robustness.
Performance Testing: Encompasses both load and stress testing, plus other tests like endurance testing (long-term stability) and spike testing (sudden increase in load). It’s a comprehensive approach to understand the system’s overall performance capabilities.
Example: Imagine an e-commerce website launching a new product. Load testing would simulate the expected traffic during the launch. Stress testing would simulate significantly higher traffic than expected to identify the maximum capacity and potential failure points. Performance testing would cover both and add tests like checking the stability after several hours under heavy load.
Q 2. Describe your experience with performance monitoring tools (e.g., Datadog, New Relic, Dynatrace).
I have extensive experience using Datadog, New Relic, and Dynatrace for performance monitoring. My experience includes instrumenting applications, setting up dashboards, creating alerts, and analyzing performance data to pinpoint bottlenecks and optimize system performance.
Datadog: I’ve used Datadog’s comprehensive monitoring capabilities to track various metrics including CPU utilization, memory consumption, network traffic, and application performance across diverse cloud environments (AWS, Azure, GCP). Its visualization tools are particularly useful for quickly identifying trends and anomalies.
New Relic: I’ve leveraged New Relic’s application performance monitoring (APM) features to monitor application code performance, identify slow database queries, and pinpoint code-level performance issues. The distributed tracing features are excellent for microservices architectures.
Dynatrace: My experience with Dynatrace includes its AI-powered capabilities for automatic anomaly detection and root cause analysis. Its ability to automatically discover and map dependencies in complex applications is incredibly beneficial for large-scale systems. This has significantly reduced the time spent troubleshooting performance issues.
In one project, using Datadog’s alerting system, we proactively identified a database query that was consistently exceeding a defined threshold, preventing a potential performance degradation during peak hours. We were able to optimize the query and avoid impacting end-users.
Q 3. How do you identify performance bottlenecks in a cloud-based application?
Identifying performance bottlenecks in cloud-based applications requires a systematic approach. I typically utilize a combination of techniques:
Monitoring Tools: I start by utilizing performance monitoring tools like those mentioned earlier (Datadog, New Relic, Dynatrace) to gather comprehensive metrics related to CPU, memory, network, disk I/O, and application performance. This gives a holistic view of the system.
Profiling Tools: For deeper insights into application code performance, I use profiling tools to identify slow functions or database queries. These tools pinpoint the exact lines of code contributing to the slowdowns.
Tracing Tools: Distributed tracing helps identify bottlenecks across microservices by showing the flow of requests through the system. This is particularly critical in microservices architectures.
Log Analysis: Reviewing application and system logs helps identify error messages, exceptions, or other events that might be contributing to performance issues.
Load Testing: By running load tests, we can simulate real-world conditions to identify bottlenecks under realistic loads. The results pinpoint the areas where the system struggles.
Example: During a recent project, we observed high CPU utilization on a specific microservice using Datadog. By using New Relic’s APM, we identified a poorly performing database query within that microservice. Optimizing this query reduced the CPU utilization significantly, improving overall application performance.
Q 4. Explain your experience with capacity planning in a cloud environment.
Capacity planning in a cloud environment involves predicting future resource needs based on current usage patterns, expected growth, and performance requirements. My experience includes:
Historical Data Analysis: Analyzing historical usage data (CPU, memory, network, storage) to establish trends and predict future resource consumption.
Load Testing and Simulation: Using load testing tools to simulate future workloads and measure resource utilization under various scenarios. This provides realistic projections.
Scalability Planning: Designing scalable architectures that can easily handle increased workloads without performance degradation. This often involves utilizing autoscaling features provided by cloud providers.
Cost Optimization: Balancing performance needs with cost optimization. We aim to provision only the necessary resources while ensuring performance is met.
In a recent project, we used historical data and load testing results to accurately predict the required resources for a major product launch. We implemented autoscaling to dynamically adjust resources based on actual traffic, avoiding over-provisioning and reducing costs while guaranteeing a smooth launch.
Q 5. Describe your experience with different cloud providers (AWS, Azure, GCP).
I have hands-on experience with AWS, Azure, and GCP, utilizing their respective services for various aspects of cloud performance engineering.
AWS: Experience with services like EC2, S3, RDS, Elastic Beanstalk, CloudWatch. I have worked extensively with auto-scaling groups, load balancers, and other managed services to optimize performance and scalability.
Azure: Experience with Azure Virtual Machines, Azure Blob Storage, Azure SQL Database, Azure App Service, and Azure Monitor. I’ve used Azure’s scaling capabilities and monitoring tools to build and manage highly available and performant applications.
GCP: Experience with Compute Engine, Cloud Storage, Cloud SQL, App Engine, and Cloud Monitoring. GCP’s serverless options have been utilized to build scalable and cost-effective applications.
My experience spans across different services and features, allowing me to choose the best-suited cloud provider and services for specific performance requirements. The selection often depends on factors such as cost, scalability needs, existing infrastructure, and specific application requirements.
Q 6. How do you approach performance optimization in a microservices architecture?
Performance optimization in a microservices architecture presents unique challenges. The distributed nature of the system makes it harder to identify bottlenecks. My approach focuses on:
Monitoring and Observability: Utilizing distributed tracing tools like Jaeger or Zipkin to track requests across multiple services and identify slow calls or latency issues.
Service-Level Objectives (SLOs): Defining clear SLOs for each service to establish performance targets and track performance over time.
Asynchronous Communication: Using asynchronous communication patterns (message queues) to decouple services and improve resilience and scalability. This prevents one slow service from impacting others.
Caching Strategies: Implementing caching mechanisms (Redis, Memcached) to reduce database load and improve response times.
Load Balancing: Using load balancers to distribute traffic evenly across multiple instances of a service.
In a past project, we used distributed tracing to pinpoint a bottleneck in a payment gateway service impacting the overall checkout process. By optimizing the database queries within the payment gateway, we drastically improved its response time, positively affecting the entire application’s performance.
Q 7. Explain your understanding of different performance testing methodologies.
My understanding of performance testing methodologies encompasses several approaches:
Load Testing: Simulates realistic user load to assess system performance under expected conditions. Tools like JMeter or Gatling are often used.
Stress Testing: Exceeds normal load to identify breaking points and system stability. We aim to find the limits of the system.
Endurance Testing (Soak Testing): Tests system stability over an extended period under sustained load. We want to see if the system can handle prolonged pressure.
Spike Testing: Simulates sudden increases in load to assess the system’s responsiveness to traffic surges.
Volume Testing: Tests the system’s ability to handle large amounts of data.
Capacity Testing: Determines the maximum user load the system can handle before performance degradation.
The choice of methodology depends on the specific testing goals. For example, if we’re concerned about the system’s ability to handle a sudden influx of users, spike testing is crucial. If we’re validating the system’s long-term stability, endurance testing is paramount. Often, a combination of methodologies provides a comprehensive understanding of the system’s performance capabilities.
Q 8. How do you handle performance issues in production?
Handling performance issues in production is a systematic process that requires a blend of proactive monitoring, rapid response, and post-mortem analysis. It starts with establishing robust monitoring systems that provide real-time visibility into key performance indicators (KPIs) like latency, throughput, error rates, and resource utilization. Think of these monitors as your early warning system. When an issue arises, my approach involves a structured process:
- Identify the problem: Pinpoint the affected area and the root cause using metrics from monitoring tools, logs, and application traces. This often involves correlating data from various sources to build a complete picture.
- Isolate the impact: Determine the scope of the problem. Is it affecting all users, or just a specific subset? Understanding the impact helps prioritize the response.
- Implement a temporary fix (if necessary): Sometimes a quick fix is needed to mitigate the immediate impact, such as increasing resource allocation or temporarily disabling a non-critical feature. This is a stop-gap measure while a permanent solution is developed.
- Investigate the root cause: Conduct thorough analysis to identify the underlying cause. This often involves code reviews, database analysis, infrastructure checks, and network analysis. For example, a sudden spike in database queries might indicate a code bug or an inefficient query.
- Implement a permanent fix: Develop and deploy a permanent solution that addresses the root cause. This might include code changes, database optimizations, infrastructure upgrades, or configuration adjustments.
- Monitor and review: After implementing the fix, continuously monitor the system to ensure the issue is resolved and doesn’t reoccur. Perform a post-mortem analysis to document the issue, the solution, and learnings to prevent similar incidents in the future.
For example, I once encountered a performance bottleneck during a major sales event. Our monitoring alerted us to a spike in database latency. By analyzing slow query logs, we identified a poorly optimized query that was causing the problem. We rewrote the query, and the performance issue was resolved. Post-mortem analysis led us to improve our database monitoring and implement automated alerts for slow queries.
Q 9. Describe your experience with auto-scaling in the cloud.
Auto-scaling is crucial for handling fluctuating workloads in the cloud. I have extensive experience using auto-scaling features offered by various cloud providers (AWS, Azure, GCP). My experience involves designing and implementing auto-scaling strategies based on different metrics, such as CPU utilization, memory usage, request rate, and queue lengths. I understand the trade-offs between cost optimization and responsiveness.
For example, in one project, we used AWS Auto Scaling groups to automatically adjust the number of EC2 instances based on CPU utilization. We configured a scaling policy to add instances when CPU utilization exceeded 70% and remove instances when it fell below 50%. This ensured that we had sufficient capacity to handle peak loads while avoiding unnecessary costs during low-traffic periods. We also utilized features like health checks to ensure only healthy instances were added to the pool.
Beyond basic scaling, I’ve worked with more sophisticated approaches, like predictive scaling, which uses machine learning to forecast future demand and proactively adjust capacity. This helps avoid scaling lags and ensures a smoother user experience. Properly configuring cooling-down periods prevents thrashing (overly frequent scaling adjustments).
Q 10. How do you ensure the scalability and reliability of a cloud application?
Ensuring scalability and reliability of a cloud application is a multi-faceted challenge that requires a holistic approach. It’s not just about throwing more resources at the problem. It’s about designing the application and its infrastructure with scalability and resilience in mind from the very beginning. Key strategies include:
- Microservices Architecture: Breaking down the application into smaller, independent services allows for independent scaling and fault isolation. If one service fails, it doesn’t bring down the entire application.
- Load Balancing: Distributing traffic across multiple instances prevents overload on any single instance. Various techniques exist, such as round-robin, least connections, and IP hash.
- Horizontal Scaling: Adding more instances to handle increased demand rather than scaling up individual instances (vertical scaling). This provides better scalability and resilience.
- Redundancy and Failover: Implementing redundancy in all critical components, including databases, storage, and network infrastructure, ensures that the application can continue to operate even if one component fails.
- Database Optimization: Optimizing database queries, schema design, and indexing is crucial for ensuring the database can handle the expected load. Consider read replicas to distribute read traffic.
- Caching: Implementing caching strategies to reduce the load on backend systems and improve response times. This can include different levels of caching (e.g., CDN, server-side cache, client-side cache).
- Monitoring and Alerting: Continuously monitoring the application and infrastructure for potential issues. Setting up alerts to proactively identify and address problems before they affect users.
A real-world example involves a project where we migrated a monolithic application to a microservices architecture. This allowed us to scale individual services based on their specific needs, resulting in significant improvements in scalability, reliability, and cost efficiency.
Q 11. Explain your experience with performance tuning databases (e.g., MySQL, PostgreSQL, MongoDB).
My experience with database performance tuning spans across several popular database systems, including MySQL, PostgreSQL, and MongoDB. The core principles remain consistent, but the specific techniques vary based on the database technology. Performance tuning is an iterative process:
- Query Optimization: Analyzing slow queries using tools like
EXPLAIN(MySQL/PostgreSQL) or profiling tools (MongoDB). Identifying bottlenecks and rewriting queries for improved efficiency. Indexing is crucial for fast data retrieval. For example, adding an index on frequently queried columns can significantly reduce query execution time. - Schema Design: Ensuring that the database schema is optimized for the application’s workload. Choosing appropriate data types, avoiding unnecessary joins, and normalizing the database to reduce data redundancy.
- Connection Pooling: Efficiently managing database connections to reduce overhead associated with connection establishment and termination. This is especially crucial for high-traffic applications.
- Caching: Using caching mechanisms to store frequently accessed data in memory for faster retrieval. This reduces the load on the database and improves application performance.
- Hardware Optimization: Ensuring that the database server has sufficient resources, such as CPU, memory, and storage, to handle the expected workload. Consider using SSDs for faster I/O operations.
- Replication and Sharding: For large databases, consider using replication to improve read performance and availability and sharding to distribute data across multiple servers to improve scalability.
In one project, we optimized a MySQL database by adding indexes, rewriting inefficient queries, and upgrading the server hardware. This resulted in a 50% reduction in query execution time.
Q 12. What are some common performance anti-patterns you’ve encountered?
Over my career, I’ve encountered several common performance anti-patterns:
- N+1 problem: Making multiple database queries for each record instead of fetching related data in a single query. This leads to significant performance degradation, especially with large datasets.
- Inefficient algorithms and data structures: Using algorithms or data structures that are not suitable for the size or complexity of the data can lead to slow processing times.
- Lack of indexing: Failing to create appropriate indexes on frequently queried database columns can result in slow query execution times.
- Ignoring caching: Not implementing caching strategies to store frequently accessed data in memory can lead to repeated database queries and slow response times.
- Blocking operations: Performing long-running operations in the main application thread, blocking other requests and causing slowdowns or unresponsiveness.
- Lack of monitoring and alerting: Not having proper monitoring systems in place to track performance metrics can make it difficult to identify and resolve performance issues.
- Unoptimized database queries: Using poorly written SQL queries or NoSQL queries can severely impact performance.
These anti-patterns often lead to unexpected performance bottlenecks that can significantly impact user experience and system stability. Proactive code review, careful design, and rigorous testing are critical in preventing these issues.
Q 13. How do you use A/B testing to improve performance?
A/B testing can be a powerful tool for improving application performance. By creating two versions of a feature (A and B), and exposing each version to a subset of users, you can measure the performance differences and objectively determine which version performs better. This can be applied to:
- Code changes: Compare the performance of different code implementations to identify the most efficient version.
- Database queries: Compare the performance of different queries to identify the most efficient way to retrieve data.
- Caching strategies: Compare different caching techniques to determine the one that yields the best performance and cost optimization.
- Infrastructure changes: Compare the performance of different infrastructure configurations to determine which setup provides the best performance and reliability.
For example, I used A/B testing to compare two different caching strategies for an e-commerce website. Version A used a simple in-memory cache, while Version B used a more complex distributed cache. By monitoring key performance metrics such as response time and hit rate, we determined that Version B significantly improved performance. A/B testing gives concrete data to drive informed decisions rather than relying on assumptions. Careful consideration must be given to statistical significance and sample size to avoid drawing inaccurate conclusions.
Q 14. Explain your understanding of caching strategies in a cloud environment.
Caching strategies are essential for improving the performance and scalability of cloud applications. The goal is to store frequently accessed data closer to the application or user, reducing the need to access slower backend systems. Several levels of caching exist, each with its own trade-offs:
- CDN (Content Delivery Network): Caches static content (images, CSS, JavaScript) closer to the users geographically, reducing latency and bandwidth consumption. This is ideal for globally distributed applications.
- Server-side caching: Caches data in-memory on the application servers, typically using technologies like Redis or Memcached. This provides fast access to frequently requested data and reduces database load. This requires careful consideration of cache invalidation strategies to maintain data consistency.
- Database caching: Some databases have built-in caching mechanisms, such as query caching or data caching. This can improve performance by storing frequently accessed data in the database server’s memory.
- Client-side caching: Caching data on the client’s browser or device using techniques like HTTP caching. This reduces the number of requests made to the server but requires careful management of cache expiration to ensure data freshness.
The choice of caching strategy depends on the specific needs of the application. For example, a website with many static assets would benefit from a CDN, while an application with frequent database queries might benefit from server-side caching. Implementing a multi-level caching strategy can offer optimal performance. Careful monitoring and management are vital to ensure the cache remains effective and doesn’t cause inconsistencies or data staleness. Involving a cache invalidation strategy is also important to account for data changes.
Q 15. How do you measure and analyze the performance of a cloud application?
Measuring and analyzing cloud application performance involves a multi-faceted approach, combining synthetic and real-user monitoring with robust data analysis. We start by defining key performance indicators (KPIs) aligned with business objectives. These might include response time, throughput, error rates, and resource utilization (CPU, memory, network).
Synthetic monitoring uses automated tools to simulate user traffic, providing insights into application behavior under various load conditions. Tools like JMeter or Gatling (discussed further in the next question) are invaluable here. We can run load tests to identify bottlenecks and assess scalability.
Real-user monitoring (RUM) captures performance data from actual user interactions. This gives us a realistic picture of end-user experience, revealing issues that might be missed in synthetic tests. RUM tools often involve browser extensions or code snippets embedded in the application.
Data analysis is crucial. We analyze the collected data, looking for trends, anomalies, and correlations. This might involve using monitoring dashboards, log analysis tools, or even custom scripts to identify root causes. For example, a spike in database query times could indicate a need for database optimization. The entire process is iterative; we continuously monitor, analyze, and optimize to ensure application performance remains optimal.
Career Expert Tips:
- Ace those interviews! Prepare effectively by reviewing the Top 50 Most Common Interview Questions on ResumeGemini.
- Navigate your job search with confidence! Explore a wide range of Career Tips on ResumeGemini. Learn about common challenges and recommendations to overcome them.
- Craft the perfect resume! Master the Art of Resume Writing with ResumeGemini’s guide. Showcase your unique qualifications and achievements effectively.
- Don’t miss out on holiday savings! Build your dream resume with ResumeGemini’s ATS optimized templates.
Q 16. Describe your experience with performance testing frameworks (e.g., JMeter, Gatling).
I have extensive experience with JMeter and Gatling, two powerful open-source performance testing frameworks. JMeter, with its intuitive GUI, is great for creating and running various test plans, including load, stress, and functional tests. I’ve used it to simulate thousands of concurrent users, assessing application responsiveness under heavy load. For example, I once used JMeter to test an e-commerce website’s ability to handle a Black Friday-level surge in traffic, identifying a bottleneck in the shopping cart process that we subsequently addressed.
Gatling, on the other hand, is a more code-centric framework using Scala. While it has a steeper learning curve, it offers better performance and scalability for larger, more complex tests. Its scripting capabilities allow for highly customized tests and precise control over test scenarios. I’ve utilized Gatling in projects requiring more sophisticated simulations, such as testing real-time streaming data pipelines. In one instance, we used Gatling to simulate millions of events per second, identifying a scaling issue in our message queue.
Beyond these tools, familiarity with other tools like k6 is also beneficial as they offer their own unique advantages depending on testing needs and environment.
Q 17. How do you handle performance issues related to network latency?
Network latency is a common performance bottleneck. Addressing it requires a systematic approach, starting with identifying the source of the latency. We use network monitoring tools to pinpoint slowdowns. Is the issue with the application’s network configuration, the cloud provider’s network, or the user’s internet connection?
Once the source is identified, solutions vary. If the latency is within the application, optimizing network calls is key. This could involve minimizing the number of requests, using content delivery networks (CDNs) to cache static content closer to users, or optimizing database queries to reduce data transfer. If the issue lies with the cloud provider’s network, exploring different regions or cloud providers might be necessary. Lastly, user-side issues might require recommendations for users to improve their internet connection.
Consider this example: A slow-loading image significantly impacts the overall page load time. We’d optimize the image by compressing it without losing too much quality and utilize a CDN for faster delivery to users across various geographic locations. This multi-pronged approach is often required to effectively mitigate network latency.
Q 18. Explain your understanding of different load balancing strategies.
Load balancing distributes incoming traffic across multiple servers, preventing overload and ensuring high availability. Several strategies exist:
- Round Robin: Distributes requests sequentially to servers. Simple but can lead to uneven load if servers have different processing capabilities.
- Least Connections: Directs requests to the server with the fewest active connections. Efficient but requires real-time monitoring of server loads.
- IP Hash: Uses the client’s IP address to determine the server. Consistent for a given client, but doesn’t distribute traffic evenly across servers.
- Weighted Round Robin: Assigns weights to servers based on capacity. Heavily loaded servers get fewer requests.
The choice depends on the application’s specific needs and the characteristics of the servers. In practice, I often find that a combination of strategies, or a more sophisticated algorithm within a load balancer, provides the best outcome. For instance, using Least Connections as a primary strategy, complemented by health checks to remove unhealthy servers from the pool, provides a robust and reliable solution.
Q 19. How do you troubleshoot slow database queries?
Troubleshooting slow database queries involves a multi-step process. First, we identify the slow queries using database monitoring tools or by examining application logs. Then, we use query analyzers (such as those built into most database systems) to analyze the query execution plan. This reveals where the bottleneck lies—is it inefficient joins, missing indexes, or excessive data retrieval?
Next, we optimize the query. Common techniques include adding indexes to frequently queried columns, rewriting inefficient joins, using appropriate data types, and optimizing data retrieval by selecting only necessary columns. Database caching and connection pooling can also significantly improve performance. Finally, we re-run the tests to confirm the improvement. In a recent project, identifying a missing index on a heavily used table resulted in a 90% reduction in query execution time.
It’s also important to consider database schema design and table partitioning strategies for large datasets. Appropriate database tuning is crucial, often requiring an understanding of the specific database system (MySQL, PostgreSQL, etc.) and its configuration parameters.
Q 20. Describe your experience with containerization and its impact on performance.
Containerization, using technologies like Docker and Kubernetes, has revolutionized cloud application deployment and significantly impacts performance. Containers provide lightweight, isolated environments for applications, leading to faster startup times, improved resource utilization, and enhanced scalability. Because they package the application and its dependencies, they ensure consistency across different environments (development, testing, production).
However, improper containerization can negatively impact performance. Overly large container images can lead to slow deployments and increased resource consumption. Insufficient resource allocation within Kubernetes can create bottlenecks. I’ve seen performance gains of up to 50% by optimizing container images and fine-tuning Kubernetes resource requests and limits. Understanding container orchestration and its impact on networking is crucial. Strategies like using container registries for fast image distribution and employing efficient networking solutions within the cluster are key to maximizing performance.
Q 21. Explain your understanding of serverless computing and its performance implications.
Serverless computing, exemplified by platforms like AWS Lambda and Azure Functions, offers a pay-as-you-go model where code executes in response to events without managing servers. This can significantly improve scalability and reduce operational overhead. However, understanding its performance implications is crucial.
Cold starts, where the function is initialized for the first time, can introduce latency. Careful function design and optimization, leveraging caching mechanisms and warm-up strategies, mitigate this. Function size and complexity also directly influence execution time. Larger functions can take longer to execute. Therefore, we aim for small, focused functions with clear boundaries, reducing execution time and improving response time. Finally, network calls within serverless functions should be optimized just like in any other application.
For instance, if we had a image processing function, we might utilize a CDN for storing and delivering images, minimizing network latency within the serverless function and thus ensuring responsiveness. Proper monitoring and analysis of execution times and resource consumption are vital for optimizing serverless applications.
Q 22. How do you optimize application code for better performance in the cloud?
Optimizing application code for cloud performance involves a multi-faceted approach focusing on efficiency and scalability. It’s not just about writing faster code; it’s about writing code that leverages cloud resources effectively.
- Profiling and Identifying Bottlenecks: We start by using profiling tools to pinpoint performance bottlenecks. This could be slow database queries, inefficient algorithms, or I/O-bound operations. Tools like YourKit, JProfiler (for Java), or the built-in profiling capabilities of cloud platforms are invaluable.
- Code Optimization Techniques: Once bottlenecks are identified, we employ various optimization techniques. This includes using efficient data structures and algorithms, minimizing database interactions (e.g., using caching, batching queries), and optimizing I/O operations. For example, replacing a nested loop with a more efficient algorithm can drastically reduce execution time.
- Asynchronous Programming: For I/O-heavy applications, asynchronous programming is crucial. Instead of waiting for long operations to complete, the application can continue processing other tasks concurrently, improving responsiveness and throughput. Node.js and Python’s asyncio libraries are good examples.
- Caching Strategies: Implementing appropriate caching mechanisms (e.g., Redis, Memcached) at various levels (e.g., data caching, response caching) dramatically reduces the load on backend systems and improves response times. Consider cache invalidation strategies to prevent stale data issues.
- Efficient Resource Utilization: Cloud resources should be utilized efficiently. This involves right-sizing instances (avoiding over-provisioning), using auto-scaling features to dynamically adjust resources based on demand, and optimizing resource allocation within the application itself.
- Containerization and Microservices: Breaking down monolithic applications into smaller, independent microservices improves scalability, fault isolation, and deployment flexibility. Containerization technologies like Docker allow for efficient packaging and deployment of these microservices.
For example, in one project, we identified a significant performance bottleneck caused by inefficient database queries in a Java application. By optimizing the queries and implementing caching, we reduced response times by over 70%.
Q 23. What are some key performance indicators (KPIs) you track?
Key Performance Indicators (KPIs) tracked for cloud applications vary depending on the specific application and business goals, but some common ones include:
- Response Time (Latency): The time it takes for an application to respond to a request. Lower is better.
- Throughput: The number of requests processed per unit of time (e.g., requests per second). Higher is better.
- Error Rate: The percentage of requests that result in errors. Lower is better.
- Resource Utilization (CPU, Memory, Network): Monitoring CPU usage, memory consumption, and network traffic helps identify resource constraints and optimize scaling.
- Database Performance: Key metrics include query execution time, transaction throughput, and connection pool usage.
- Application Errors and Exceptions: Tracking the frequency and type of errors allows for proactive problem resolution.
- Availability and Uptime: Percentage of time the application is operational and accessible.
We also track custom KPIs based on the specific business requirements. For instance, in an e-commerce application, we might track conversion rates and average order value to understand the impact of performance on business outcomes.
Q 24. Explain your experience with using cloud-native monitoring tools.
I have extensive experience with various cloud-native monitoring tools, including:
- CloudWatch (AWS): I use CloudWatch extensively for monitoring various AWS resources, including EC2 instances, databases, and Lambda functions. Its rich metrics and customizable dashboards provide deep insights into application performance and resource usage. I utilize CloudWatch Alarms to set thresholds and receive alerts for critical events.
- Stackdriver (Google Cloud): I’ve used Stackdriver (now Google Cloud Monitoring) for monitoring Google Cloud Platform (GCP) resources. It provides similar functionality to CloudWatch, offering comprehensive monitoring and alerting capabilities.
- Azure Monitor (Microsoft Azure): I have experience with Azure Monitor for monitoring Azure resources. It’s integrated well with other Azure services and offers powerful log analytics and application performance monitoring features.
- Prometheus and Grafana: These open-source tools are excellent for monitoring containerized applications. Prometheus collects metrics from various sources, and Grafana allows for the creation of custom dashboards and visualizations.
My approach involves integrating monitoring tools early in the development lifecycle. This allows us to track performance from the beginning, enabling proactive identification and mitigation of issues. I also emphasize creating customized dashboards that visualize critical KPIs, enabling rapid identification of problems.
Q 25. How do you ensure the security of a high-performance cloud application?
Securing a high-performance cloud application is paramount. It’s a holistic approach incorporating several key strategies:
- Infrastructure Security: Secure the underlying infrastructure using features like virtual private clouds (VPCs), security groups, and network access controls. Restrict access to resources based on the principle of least privilege.
- Application Security: Implement secure coding practices to prevent vulnerabilities like SQL injection and cross-site scripting (XSS). Regularly conduct security audits and penetration testing.
- Data Protection: Encrypt data both in transit and at rest. Implement access controls to restrict data access to authorized personnel only.
- Identity and Access Management (IAM): Utilize robust IAM systems to control access to cloud resources. Implement multi-factor authentication (MFA) to enhance security.
- Security Monitoring and Logging: Utilize security information and event management (SIEM) tools to monitor security logs and detect suspicious activity. Set up alerts for security-related events.
- Regular Updates and Patching: Keep all software and infrastructure components up-to-date with the latest security patches.
- Vulnerability Scanning and Penetration Testing: Regularly perform vulnerability scans and penetration tests to identify and address security weaknesses.
For instance, implementing Web Application Firewalls (WAFs) can help mitigate common web application attacks, while using secrets management services can secure sensitive information like database passwords and API keys.
Q 26. Describe a time you had to debug a complex performance issue.
I once encountered a complex performance issue in a large-scale e-commerce application. The application experienced intermittent slowdowns, impacting customer experience and sales. Initial investigations revealed no obvious bottlenecks. Our debugging process involved:
- Comprehensive Monitoring: We started by analyzing logs, metrics, and traces from various sources. This included application logs, database logs, and infrastructure monitoring data.
- Identifying Patterns: We observed that slowdowns frequently coincided with specific promotional periods. This suggested that the issue was related to increased traffic loads.
- Load Testing: We conducted load tests to simulate peak traffic conditions. This helped us pinpoint the performance bottlenecks under stress.
- Database Optimization: Load testing identified slow database queries as a primary culprit. We optimized database queries, added indexes, and implemented connection pooling to improve database performance.
- Caching Strategy Improvements: We revised the caching strategy to better handle peak loads, improving response times under stress.
- Autoscaling Enhancement: We adjusted the auto-scaling policies to scale resources more aggressively during peak demand.
By systematically investigating the issue and implementing these solutions, we resolved the performance problems, significantly improving application responsiveness and stability during peak periods.
Q 27. How do you stay up-to-date with the latest trends in cloud performance engineering?
Staying current in cloud performance engineering requires a multifaceted approach:
- Industry Conferences and Webinars: I regularly attend industry conferences like AWS re:Invent, Google Cloud Next, and Microsoft Ignite. Webinars and online workshops are also a valuable resource.
- Online Courses and Certifications: Platforms like Coursera, edX, and Udemy offer numerous cloud-related courses. Obtaining relevant certifications (e.g., AWS Certified Solutions Architect) demonstrates expertise.
- Technical Blogs and Publications: Following influential blogs and publications from major cloud providers and industry experts keeps me updated on the latest trends and best practices.
- Open-Source Projects and Communities: Engaging with open-source projects and communities offers valuable insights into cutting-edge technologies and approaches. Contributing to projects directly enhances my knowledge.
- Professional Networks: Participating in online forums and professional organizations like the ACM SIGOPS provides opportunities for networking and knowledge sharing.
This continuous learning helps me adapt to the rapidly evolving landscape of cloud technologies and best practices, ensuring I remain at the forefront of the field.
Q 28. What are your salary expectations?
My salary expectations are commensurate with my experience and skills in cloud performance engineering. Considering my expertise, proven track record, and the current market rates, I am targeting a salary range of [Insert Salary Range Here]. However, I am open to discussing this further based on the specific responsibilities and benefits offered.
Key Topics to Learn for Cloud Performance Engineering Interview
- Cloud Infrastructure Fundamentals: Understanding various cloud providers (AWS, Azure, GCP), their services (compute, storage, networking), and architectural patterns. Practical application: Designing a highly available and scalable system on a chosen cloud platform.
- Performance Monitoring and Analysis: Mastering tools and techniques for monitoring application and infrastructure performance. Practical application: Identifying bottlenecks and performance issues using tools like CloudWatch, Datadog, or Prometheus. Analyzing logs and metrics to pinpoint root causes.
- Capacity Planning and Scaling: Forecasting resource needs based on projected growth and workload demands. Practical application: Designing a scaling strategy to handle peak loads and ensure optimal performance under varying conditions.
- Performance Testing and Optimization: Conducting load tests, stress tests, and performance tests to identify areas for improvement. Practical application: Implementing and interpreting results from performance testing tools like JMeter or k6. Optimizing code and infrastructure to improve response times and throughput.
- Cost Optimization Strategies: Understanding how to optimize cloud costs while maintaining performance. Practical application: Implementing strategies for right-sizing instances, utilizing reserved instances, and optimizing data storage.
- Automation and DevOps Practices: Integrating performance engineering into CI/CD pipelines. Practical application: Automating performance tests and monitoring using scripting and infrastructure-as-code.
- Security Considerations: Understanding security best practices related to cloud performance engineering. Practical application: Integrating security into performance testing and optimization strategies to mitigate vulnerabilities.
Next Steps
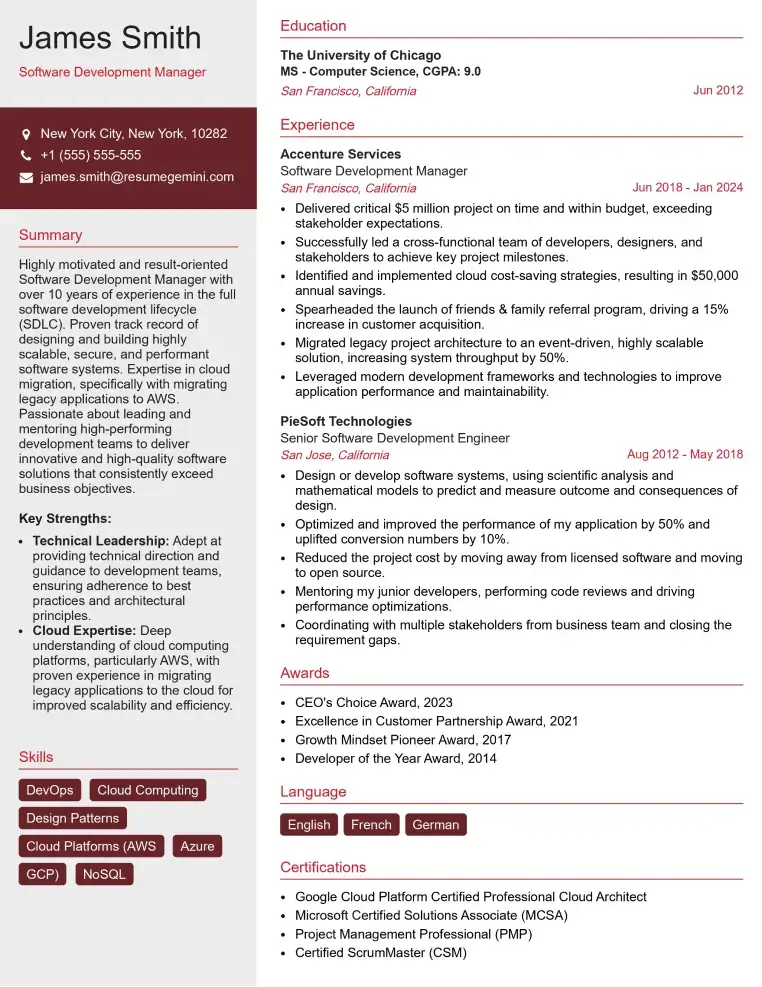
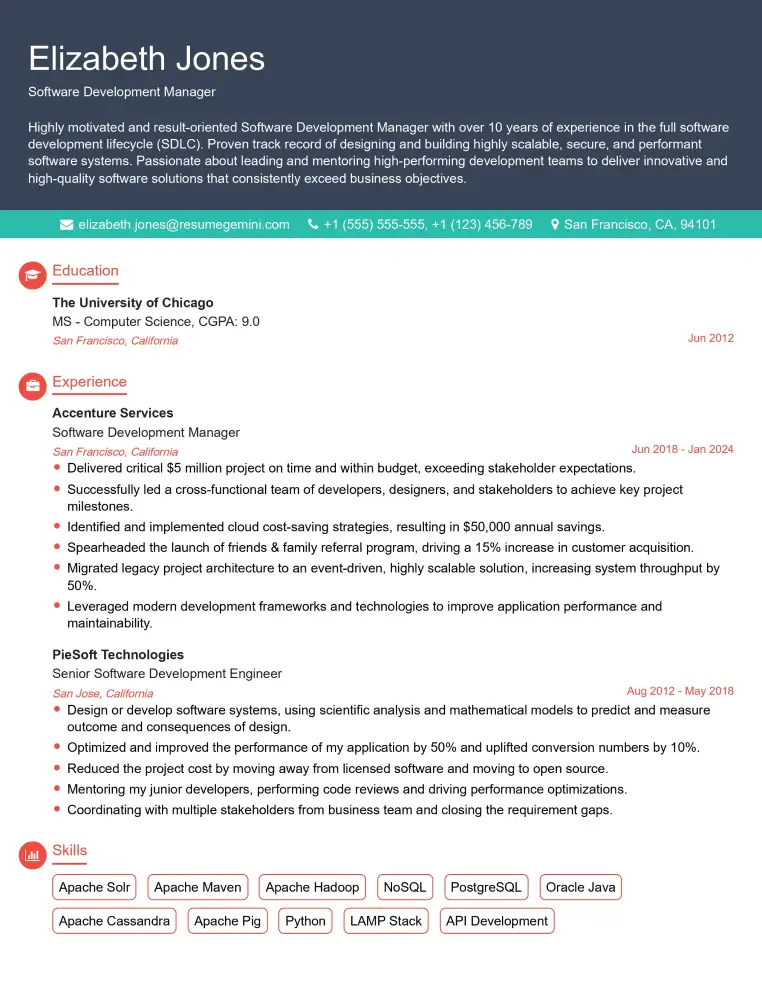
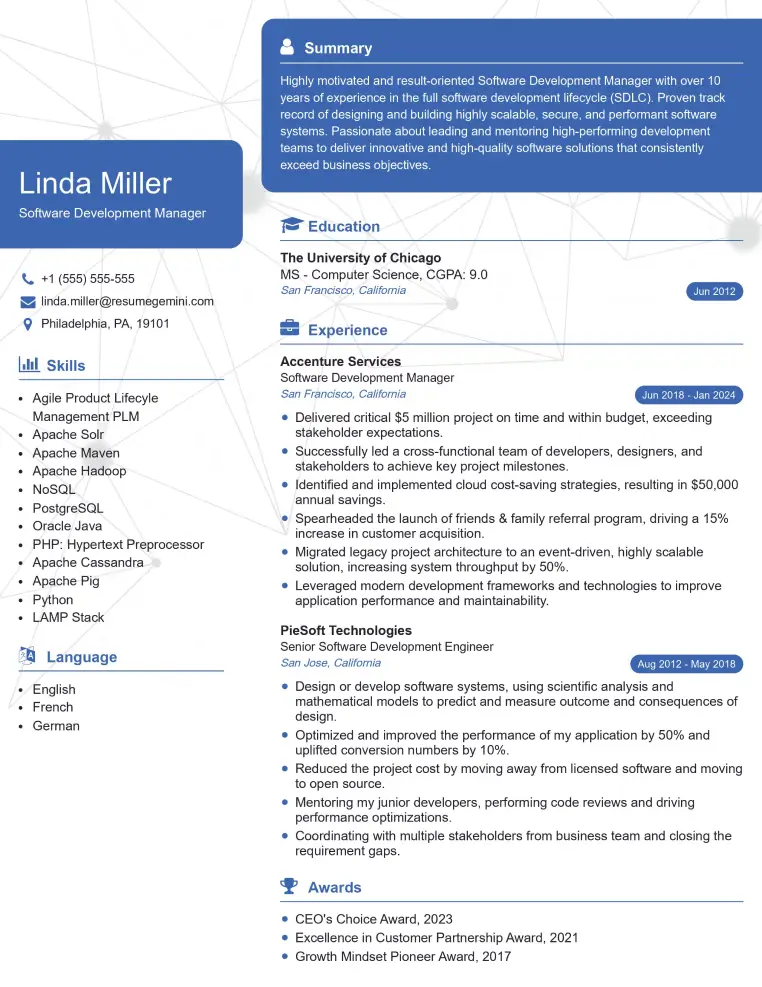
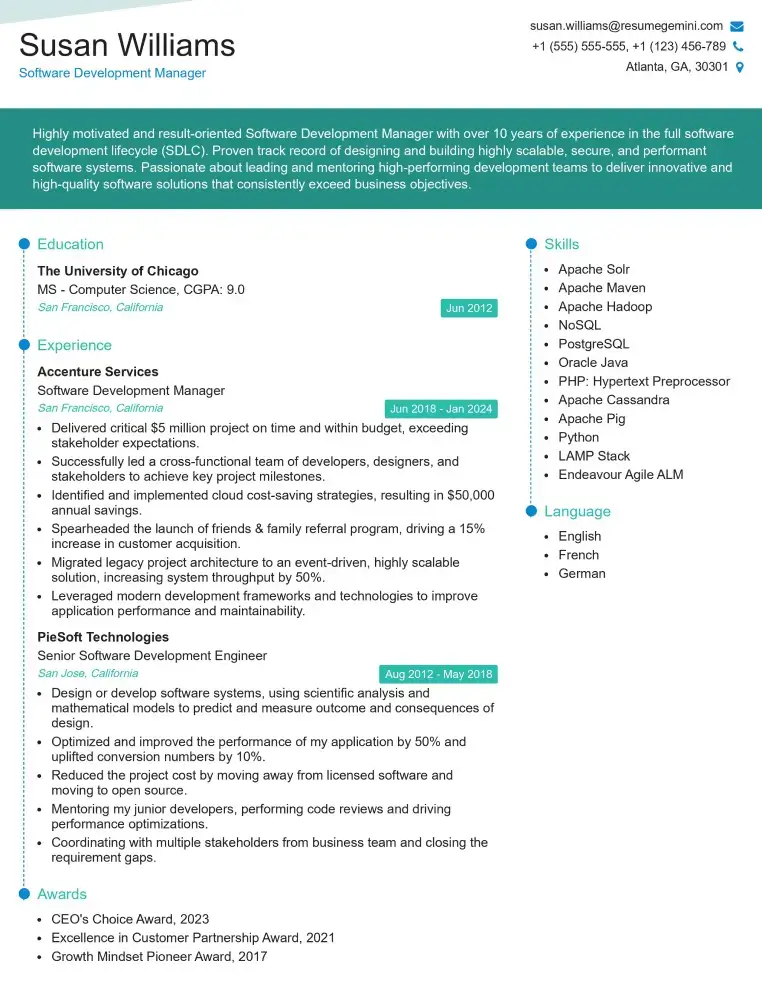
Mastering Cloud Performance Engineering opens doors to exciting and high-demand roles within the technology industry. It’s a skillset that’s consistently sought after, offering excellent career growth opportunities and competitive compensation. To maximize your job prospects, invest time in crafting a compelling and ATS-friendly resume that highlights your skills and experience effectively. ResumeGemini is a trusted resource that can help you build a professional resume tailored to your specific needs. Examples of resumes specifically designed for Cloud Performance Engineering professionals are available to guide you.
Explore more articles
Users Rating of Our Blogs
Share Your Experience
We value your feedback! Please rate our content and share your thoughts (optional).
What Readers Say About Our Blog
Amazing blog
hello,
Our consultant firm based in the USA and our client are interested in your products.
Could you provide your company brochure and respond from your official email id (if different from the current in use), so i can send you the client’s requirement.
Payment before production.
I await your answer.
Regards,
MrSmith
These apartments are so amazing, posting them online would break the algorithm.
https://bit.ly/Lovely2BedsApartmentHudsonYards
Reach out at [email protected] and let’s get started!
Take a look at this stunning 2-bedroom apartment perfectly situated NYC’s coveted Hudson Yards!
https://bit.ly/Lovely2BedsApartmentHudsonYards
Live Rent Free!
https://bit.ly/LiveRentFREE
Interesting Article, I liked the depth of knowledge you’ve shared.
Helpful, thanks for sharing.
Hi, I represent a social media marketing agency and liked your blog
Hi, I represent an SEO company that specialises in getting you AI citations and higher rankings on Google. I’d like to offer you a 100% free SEO audit for your website. Would you be interested?
