Interviews are more than just a Q&A session—they’re a chance to prove your worth. This blog dives into essential OmniGraffle/Visio interview questions and expert tips to help you align your answers with what hiring managers are looking for. Start preparing to shine!
Questions Asked in OmniGraffle/Visio Interview
Q 1. Explain the difference between OmniGraffle’s Smart Shapes and regular shapes.
OmniGraffle’s Smart Shapes are a game-changer compared to regular shapes. Think of regular shapes as simple building blocks – you get a rectangle, a circle, etc., and that’s it. Smart Shapes, on the other hand, are intelligent containers that dynamically adjust their appearance and behavior based on the data you input. They’re like LEGOs with built-in instructions; you can place text within them, and the shape automatically resizes to fit the content, adding connectors and adjusting for labels. For example, a Smart Shape representing a database might automatically expand to accommodate a longer name or change its icon based on the database type. This saves a significant amount of time and effort compared to manually adjusting regular shapes, ensuring a professional and consistent design. Regular shapes require manual resizing and positioning, which is time-consuming and prone to errors, especially in complex diagrams.
Q 2. How do you manage layers effectively in OmniGraffle?
Effective layer management in OmniGraffle is crucial for creating complex and well-organized diagrams. Imagine a layered cake: each layer represents a distinct aspect of your diagram. I always start by organizing my layers logically, perhaps with layers for different system components, user interactions, or data flows. In OmniGraffle, I use the layer panel to create, rename, and reorder layers. This allows me to hide or show specific elements as needed, simplifying my workflow and preventing visual clutter. For instance, I might create separate layers for backgrounds, main elements, annotations, and connectors. This allows me to adjust each element independently without affecting others. A great feature is locking layers to prevent accidental modifications. When working on a specific aspect of the diagram, I might lock all layers except the one I’m actively working on. This reduces the likelihood of unintended changes and keeps the project organized, even in complex projects with hundreds of elements.
Q 3. Describe your experience using stencils and master shapes in Visio.
My experience with Visio stencils and master shapes has been invaluable for creating consistent and efficient diagrams. Stencils are essentially libraries of pre-made shapes, while master shapes are reusable templates that can be customized and updated across a project. Think of them as your design toolkit. I frequently use them to create standardized icons for various components in a network diagram or different types of servers in a system architecture diagram. The key is to create master shapes that can be easily modified—for instance, adding different attributes or colors without altering the entire shape’s structure. I always try to create master shapes that are well-documented and easy to understand, so anyone on my team can use them. When a change is needed, updating a master shape automatically updates all instances of that shape across the document, preserving consistency and reducing the chance of errors. This consistency is especially important in large projects where multiple people are working on different diagrams simultaneously.
Q 4. How do you ensure consistency in design across multiple diagrams?
Ensuring design consistency across multiple diagrams is paramount for clarity and professional presentation. My approach involves using a combination of techniques. First, I establish a style guide that specifies fonts, colors, line thicknesses, and shape styles. This document acts as a blueprint for all diagrams. Second, I heavily leverage master shapes and stencils in Visio, or Smart Shapes in OmniGraffle, so consistent elements are used across different diagrams. Changes to a master shape are automatically reflected everywhere it’s used. Third, I utilize templates. Starting each diagram from a pre-designed template pre-populates the necessary style elements, ensuring consistency from the outset. Finally, regular reviews and audits of diagrams are essential to identify and correct any inconsistencies, maintaining uniformity throughout the project’s lifecycle. This ensures that all diagrams have a cohesive visual style, regardless of who created them.
Q 5. What are some best practices for creating clear and concise diagrams?
Creating clear and concise diagrams is about prioritizing understanding over complexity. Here are some key best practices:
- Keep it simple: Avoid unnecessary details. Focus on conveying the core message. Think less is more.
- Use clear labels: Labels should be unambiguous and easy to read. Consistent font styles and sizes are key.
- Consistent visual style: Employ consistent shapes, colors, and fonts for similar elements.
- Strategic use of white space: White space improves readability and prevents visual clutter.
- Appropriate level of detail: The level of detail should be appropriate for the audience. A high-level diagram for executives will differ greatly from a detailed technical diagram for developers.
- Choose the right diagram type: Select the diagram type best suited for your purpose (flowcharts, UML diagrams, network diagrams, etc.).
Q 6. How would you handle version control for your diagrams?
Version control for diagrams is vital, especially in collaborative projects. I typically use a version control system like Git, along with a platform like GitHub or GitLab. However, since diagrams aren’t typically plain text, I employ specialized strategies. I export my diagrams into a common vector format such as SVG or PDF and then commit these files to the repository. This allows for tracking changes and reverting to earlier versions if necessary. Additionally, I utilize detailed commit messages that clearly outline the changes made in each version. Regular backups are crucial as a secondary safeguard. This helps to manage different iterations of a diagram, facilitating collaboration and allowing for easy recovery from mistakes. It’s just like tracking changes in any other codebase; you don’t want to lose your work.
Q 7. Explain your process for importing and exporting diagrams in different formats.
My process for importing and exporting diagrams involves selecting the optimal format based on the intended use. For seamless integration with other applications, I often utilize vector formats like SVG or PDF for maximum fidelity and scalability. These formats can be easily imported and exported by most design and document applications. When sharing with a broader audience, PDF is often a safer bet as most users can open it, even without specialized software. For collaboration within a specific team using the same diagramming software, the native format (e.g., .graffle for OmniGraffle, .vsdx for Visio) is best. I always test the imported file to ensure all elements are correctly rendered. It’s important to consider the potential limitations of different formats; sometimes information might be lost during conversion.
Q 8. Describe your experience using collaboration features in either OmniGraffle or Visio.
My experience with collaboration features in diagramming software centers around both OmniGraffle and Visio. In Visio, co-authoring features, especially within the Microsoft ecosystem, are seamless. You can share a Visio file on OneDrive or SharePoint, and multiple users can work on it concurrently, seeing each other’s changes in real-time. This is particularly useful for large projects where multiple stakeholders need to contribute. Version history is also crucial, allowing you to revert to previous versions if needed. OmniGraffle’s collaborative features, while not as fully integrated, offer strong functionality through features like sharing files on cloud services like Dropbox or iCloud, or through direct file sharing. While real-time co-editing might not be as robust, the ability to easily share and update a file collaboratively is still very valuable. I’ve used this to manage revisions of flowcharts during a software development project, allowing designers and programmers to work together efficiently.
Think of it like a shared Google Doc, but for diagrams. It fosters a more fluid and efficient workflow compared to traditional email-based revisions.
Q 9. How do you create a flow chart in Visio?
Creating a flowchart in Visio is straightforward. First, you’ll select the ‘Flowchart’ template from the available options when creating a new document. This provides you with a pre-populated shape library containing all the common flowchart symbols—like start/end, process, decision, input/output, etc. Then, simply drag and drop the required shapes onto the canvas, arranging them to represent the flow. You then connect the shapes using the ‘connectors’ tools. Visio automatically handles the connection points for you, which makes it really user-friendly. For example, you could create a simple flowchart detailing the process of ordering a product online, beginning with a ‘Start’ shape, moving through ‘Choose Product’, ‘Add to Cart’, ‘Checkout’, and finally ‘Order Confirmation’ shapes, each connected by appropriate flow lines.
Visio even provides smart shapes that can automatically adjust connections when you move them around, which is a huge timesaver, especially in complex charts.
Q 10. How do you create a UML diagram in OmniGraffle?
OmniGraffle doesn’t have a dedicated UML stencil in the same way Visio does. However, you can create UML diagrams effectively using OmniGraffle’s flexibility. You’ll need to rely on creating custom shapes or leveraging basic shapes combined with text to represent the different UML elements. For instance, you would use rectangles for classes, arrows for relationships, and specialized notations for attributes and methods. The key is to establish a consistent visual style guide within the document to ensure clarity. For example, to represent a class diagram, I’d use rectangles for class names, compartments for attributes and methods, and different arrow styles to denote inheritance or association.
While lacking pre-built stencils, OmniGraffle’s powerful shape customization features offer the tools to create a very professional UML diagram tailored precisely to the project needs. This approach necessitates careful planning of your shape designs upfront to maintain consistency.
Q 11. What are the advantages of using shape libraries in Visio?
Shape libraries in Visio are invaluable for several reasons. Firstly, they save considerable time. Instead of manually creating shapes, you have a collection of pre-designed, professionally-made components. This is especially beneficial for standard diagrams, like flowcharts or network diagrams. Secondly, they ensure consistency. Using pre-designed shapes maintains a uniform appearance, making your diagrams much easier to read and understand. Thirdly, they often come with built-in functionalities. Some shapes might automatically adjust their connectors or have intelligent formatting.
Imagine creating a network diagram. Having a library of pre-made network device shapes (routers, switches, servers) saves significant time and effort. The professional look and intuitive connections improve the overall quality of the diagram.
Q 12. How do you create custom shapes in OmniGraffle?
Creating custom shapes in OmniGraffle is a powerful feature that allows tailoring the diagram to your specific requirements. You can start by drawing a shape using the basic drawing tools—rectangles, ovals, lines, etc.—then you can combine, group, and modify these to create more complex forms. You can then add text, images, and even use the advanced capabilities of the program to add gradients, shadows, and other visual effects to create custom shape masters. These masters can be saved and reused throughout the document and across future documents, improving your workflow considerably.
For instance, to create a custom database shape, I would start with a rectangle, add smaller rectangles within to represent tables, use lines to show relationships, and then add text labels for clarity and easy identification. Once saved as a master, I can simply drag and drop this custom shape into future diagrams, maintaining a uniform style and speeding up the process.
Q 13. How would you troubleshoot a problem with a complex diagram?
Troubleshooting a complex diagram involves a systematic approach. I’d start by isolating the problem area. If the issue is visual—overly cluttered, hard to read—I’d reassess the layout, perhaps using layers or grouping to manage complexity. I might need to employ more whitespace or adjust fonts to improve readability. If the problem lies in functionality (e.g., a connector doesn’t work correctly), I’d check the properties of shapes and connectors, ensuring correct connections are established. I might try simplifying the diagram temporarily to find the root cause. If nothing works, I might even create a smaller, simpler test diagram to help identify if the issue is with the software or with my methodology.
Sometimes, simply taking a break and returning with fresh eyes can help find a simple solution you overlooked previously. Detailed version control (like in Visio) can also be extremely valuable in complex projects, allowing you to revert to earlier versions if problems arise.
Q 14. How do you ensure your diagrams are accessible to users with disabilities?
Accessibility for users with disabilities is crucial. In both OmniGraffle and Visio, this primarily involves providing alternative text for images and shapes. This descriptive text is crucial for screen readers used by visually impaired individuals. It helps to carefully label all elements, use sufficient color contrast between text and backgrounds, and avoid using color alone to convey information. Additionally, maintaining a well-organized and clear layout with consistent formatting makes diagrams significantly easier for everyone to understand, including those with cognitive disabilities. Using semantic descriptions and avoiding overly complex arrangements helps significantly.
Consider adding alt text like “Database Server, connected to three client computers” instead of just leaving a server icon without description. Ensuring enough contrast between text and background (using a contrast checker tool is useful) and using clear, consistent fonts helps to make the diagram more accessible.
Q 15. How do you optimize diagrams for printing or presentation?
Optimizing diagrams for printing or presentation involves ensuring clarity, readability, and visual appeal. This goes beyond simply creating the diagram; it’s about preparing it for its intended audience and medium.
- Resolution and Size: For printing, ensure your diagram is at a high enough resolution (at least 300 DPI) to prevent pixelation. Adjust the overall size to fit the page without excessive scaling. In Visio, you can adjust print settings to control scaling and page margins. In OmniGraffle, exporting at the correct resolution is crucial.
- Color Palette and Contrast: Use a color palette that is both visually appealing and easy to read, even when printed in grayscale. Ensure sufficient contrast between text and background colors. Avoid using very light or very dark colors which can be problematic when printed.
- Font Choice and Size: Select fonts that are clear and legible, even at smaller sizes. Use a consistent font style throughout the diagram. Avoid using overly decorative fonts which can become unreadable at smaller sizes.
- Whitespace and Layout: Incorporate sufficient whitespace to improve readability and prevent the diagram from looking cluttered. Ensure that elements are logically arranged and groupings are clearly defined. Visio and OmniGraffle provide tools for aligning and distributing shapes.
- Exporting for Presentations: For presentations, exporting as a high-resolution image (PNG or JPG) often works well. For maximum flexibility, consider exporting as a vector graphic (SVG) which can be scaled without losing quality. You can also embed the diagram in presentation software like PowerPoint or Keynote.
For example, if I’m creating a network diagram for a presentation, I’d use a clear, simple color scheme, easily readable fonts like Arial or Calibri, and ensure sufficient whitespace between network components to avoid a visually cluttered mess.
Career Expert Tips:
- Ace those interviews! Prepare effectively by reviewing the Top 50 Most Common Interview Questions on ResumeGemini.
- Navigate your job search with confidence! Explore a wide range of Career Tips on ResumeGemini. Learn about common challenges and recommendations to overcome them.
- Craft the perfect resume! Master the Art of Resume Writing with ResumeGemini’s guide. Showcase your unique qualifications and achievements effectively.
- Don’t miss out on holiday savings! Build your dream resume with ResumeGemini’s ATS optimized templates.
Q 16. What are some techniques for simplifying complex information in a diagram?
Simplifying complex information in a diagram requires strategic thinking and a focus on the key message. The goal is to convey the essential information without overwhelming the viewer.
- Hierarchical Structure: Break down complex information into smaller, manageable chunks using hierarchical structures like mind maps or tree diagrams. This allows viewers to grasp the big picture before delving into details.
- Abstraction and Generalization: Avoid unnecessary detail. Focus on the high-level concepts and relationships. For example, instead of showing every individual task in a workflow, represent them as groups of tasks.
- Visual Hierarchy: Use visual cues like size, color, and font weight to emphasize important elements and de-emphasize less crucial details. This helps guide the viewer’s eye to the most important information.
- Data Visualization Techniques: Leverage charts and graphs to visually represent numerical data. This can often be much more effective than presenting the same information in tables or paragraphs. For example, instead of listing performance metrics in a table, use a bar chart to compare them visually.
- Interactive Elements (if applicable): If you are creating a digital diagram, consider adding interactive elements like tooltips or expandable sections to reveal more detail on demand. This allows you to simplify the initial view without losing any information.
Imagine explaining a complex software architecture. Instead of showing every single class and method, you’d create a high-level diagram showing the main modules and their interactions, leaving detailed class diagrams for separate documentation.
Q 17. Describe your experience using data linking in Visio.
My experience with data linking in Visio centers around using it to dynamically update diagrams based on external data sources like Excel spreadsheets or databases. This allows for the creation of ‘live’ diagrams that automatically reflect changes in the underlying data.
I’ve used this feature extensively to create dashboards showing real-time system status, organizational charts updated with personnel changes, or network diagrams reflecting current network configurations. The process typically involves connecting Visio to the data source, mapping data fields to shapes and shape properties, and refreshing the link to update the diagram.
For example, I once created a network map where each server shape was linked to an Excel sheet containing server specifications (CPU, RAM, etc.). When an update was made in the spreadsheet (say, a new RAM module installed), the information on the Visio diagram automatically updated to reflect the change. This eliminated the tedious manual updating of the diagram and ensured accuracy.
I’m familiar with troubleshooting issues related to data linking, such as data type mismatches, corrupted links, and performance issues with large datasets. I understand the importance of maintaining a clear mapping between data fields and diagram elements to ensure data integrity.
Q 18. How do you use connectors effectively in OmniGraffle?
Effective use of connectors in OmniGraffle is critical for creating clear and understandable diagrams. Connectors illustrate relationships between shapes and help avoid visual clutter.
- Choosing the Right Connector Type: OmniGraffle offers various connector types (straight, curved, orthogonal). Select the type that best represents the relationship. Straight lines are suitable for simple relationships, curved lines for less formal relationships, and orthogonal lines (right-angled) for structured diagrams.
- Routing and Aesthetics: OmniGraffle provides tools for automatically routing connectors, avoiding overlaps with other shapes. Manually adjusting connector routing can improve the visual appeal and clarity, but needs careful consideration to avoid creating a cluttered diagram.
- Labeling and Annotation: Clearly label connectors to describe the relationships they represent. Adding annotations can provide further context or details about the connection. This helps ensure viewers understand the connections, even without detailed study of the diagram.
- Consistency: Maintain consistency in connector style and labeling throughout the diagram. This improves readability and makes the diagram more professional and easier to interpret.
- Using Groups: For complex diagrams, grouping shapes and their connectors can improve manageability and simplify the overall layout. This keeps connected shapes together, especially important during modifications.
For instance, in a flowchart, I’d use orthogonal connectors to show the sequential flow between steps. In an organizational chart, I might use curved connectors to represent less direct reporting structures.
Q 19. Explain your experience with different diagramming styles (e.g., BPMN, UML, flowchart).
I have extensive experience with various diagramming styles, including BPMN (Business Process Model and Notation), UML (Unified Modeling Language), and flowcharts. My understanding extends to their specific notations, best practices, and application in different contexts.
- BPMN: I’ve used BPMN to model business processes, focusing on activities, gateways, events, and message flows. This includes creating swimlane diagrams to show process ownership. I’m familiar with the various event types, gateway types, and activity types within the BPMN specification.
- UML: My UML experience covers various diagram types, including class diagrams, sequence diagrams, use case diagrams, and activity diagrams. I can create diagrams to model object-oriented systems, showing class relationships, interactions, and use cases.
- Flowcharts: I’m proficient in creating flowcharts to visualize algorithms, workflows, and decision-making processes. I can use different symbols and notations to represent various operations, decisions, and data flows.
In a project involving software development, I might use UML class diagrams to represent the object-oriented design, sequence diagrams to model the interactions between objects, and BPMN diagrams to model the business processes that the software supports.
I always adapt my approach to the specific needs of the project and the target audience. The choice of diagramming style depends on what aspect of the system or process I’m trying to communicate.
Q 20. How would you create a diagram from a textual description?
Creating a diagram from a textual description involves careful analysis and translation of the written information into a visual representation. This requires a clear understanding of the text and the appropriate diagramming style.
- Analyze the Text: Carefully read the textual description to identify the key elements, their relationships, and the overall structure. This might involve identifying nouns (entities), verbs (actions or relationships), and modifiers.
- Choose a Diagramming Style: Select the most appropriate diagramming style based on the type of information being represented (flowchart, UML, network diagram, etc.).
- Identify Key Components: Based on the chosen diagramming style, identify the key components that need to be represented in the diagram (e.g., shapes, connectors, labels). This is where understanding the notations of your chosen style is vital.
- Create the Diagram: Use the chosen diagramming tool (Visio, OmniGraffle, etc.) to create the diagram, placing shapes and connectors to represent the identified components and relationships.
- Review and Refine: Carefully review the diagram to ensure accuracy, completeness, and clarity. Make any necessary adjustments to improve the diagram’s readability and visual appeal.
For example, if the textual description outlines steps in a software installation process, I’d create a flowchart. If the description details the classes and methods in a software application, I’d use a UML class diagram. A textual description of a network’s topology would result in a network diagram.
Q 21. How do you handle changes in requirements while creating a diagram?
Handling changes in requirements during diagram creation is an essential part of the process. Flexibility and iterative refinement are key.
- Version Control: Maintain different versions of the diagram. This allows you to revert to previous versions if necessary and provides a history of the changes made.
- Incremental Updates: Incorporate changes incrementally rather than trying to rebuild the entire diagram from scratch. This minimizes disruption and reduces the risk of errors.
- Communication: Maintain open communication with stakeholders to ensure that everyone is aware of the changes and their implications.
- Feedback Loops: Regularly review the diagram with stakeholders to obtain feedback and identify areas that need improvement.
- Flexibility: Use a diagramming tool that allows for easy editing and modification of the diagram.
Imagine a scenario where, mid-way through creating a workflow diagram, a new step is added to the process. I would add the new step to the existing diagram, re-routing connectors as needed, updating labels, and ensuring the overall flow remains logical. Version control would allow me to see the previous version if any issues arise from the modifications. I’d also ensure to communicate this change with stakeholders.
Q 22. What are your preferred methods for validating diagram accuracy?
Validating diagram accuracy is crucial for ensuring the diagram’s reliability and usefulness. My approach involves a multi-step process combining automated checks with manual review. I begin with data validation: I meticulously check that the data represented in the diagram – be it network connections, process flows, or organizational charts – accurately reflects the source material. This might involve comparing the diagram against spreadsheets, databases, or other documentation. For example, if I’m diagramming a network, I’ll cross-reference IP addresses and subnet masks. Next, I perform a logical consistency check: I look for inconsistencies or contradictions within the diagram itself. Does the flow make sense? Are there any missing links or unexplained connections? Are labels and annotations clear and unambiguous? Finally, I conduct a peer review. Having another set of eyes on the diagram helps to identify errors or areas of ambiguity that I might have missed.
For instance, in a Visio flowchart depicting a customer onboarding process, I’d verify that each step flows logically to the next, that all necessary documents and approvals are accounted for, and that there are no redundant or missing steps. I’d then share the diagram with a colleague for feedback, ensuring a second pair of eyes catches any oversight.
Q 23. Explain your experience using templates in OmniGraffle or Visio.
Templates are invaluable for maintaining consistency and efficiency in diagram creation. In both OmniGraffle and Visio, I extensively use templates to establish a standardized look and feel across all my diagrams. I find pre-built templates particularly useful for common diagram types like UML diagrams, network diagrams, and flowcharts. However, I also create custom templates to reflect specific project needs or company branding guidelines. This involves defining master shapes, color palettes, fonts, and consistent notations.
For example, I might create a custom Visio template for network diagrams, specifying standard shapes for routers, switches, servers, and firewalls, with pre-defined connection lines and consistent labeling conventions. This ensures that all network diagrams created using this template look uniform and are easy to understand, regardless of who created them.
Q 24. How do you maintain consistency in notation and style across multiple diagrams?
Maintaining consistency is key to creating easily understandable and professional diagrams. My strategy relies on a combination of template usage (as discussed previously) and the application of style guides. I create comprehensive style guides for each project, defining the specific notation, color schemes, font styles, and shape libraries to be used. In OmniGraffle and Visio, this is easily enforced using master layers, stencils and style sheets. These style guides serve as a reference for everyone involved in diagram creation, ensuring a unified visual language. Using consistent style guidelines is crucial for large projects with multiple contributors, eliminating inconsistencies and enhancing overall readability.
Consider a software development project. A consistent style guide would define the shapes for different components (databases, servers, APIs), use of specific colors to represent different statuses (e.g., green for active, red for error), and a standard font for all text elements. This approach ensures all diagrams, even if created by different team members, maintain uniformity and clarity.
Q 25. Describe your process for creating a user-friendly legend or key for a diagram.
A clear and concise legend is vital for diagram comprehension. My process begins by identifying all unique symbols, shapes, lines, and notations used in the diagram. I then organize these elements logically, often grouping them by category. Each element is clearly labeled with its meaning. I aim for simplicity and visual clarity. The legend is placed prominently, either within the diagram itself (if space allows) or on a separate page, and it’s consistently formatted with the rest of the diagram’s design. I also consider the target audience when designing the legend, employing language and visuals that are appropriate for their level of technical expertise.
In a diagram showing a manufacturing process, for instance, I might use a legend to define shapes representing different machines, arrows showing material flow, and colors denoting different stages of production. The legend would be concise, easy to read, and perfectly aligned with the visual language used throughout the diagram.
Q 26. What tools or techniques do you use to improve the visual clarity of your diagrams?
Visual clarity is paramount for effective diagram communication. I employ several techniques to enhance this. Firstly, I use white space effectively to avoid a cluttered look. Secondly, I utilize color strategically, to highlight key elements and aid in grouping information – but cautiously avoiding overuse which can create visual noise. Thirdly, I employ hierarchical layering to emphasize important elements while relegating less crucial details to the background. I utilize consistent font sizes and styles for improved readability. And finally, I leverage the grouping and layering features of OmniGraffle and Visio to organize complex diagrams into manageable components.
For example, in a complex network diagram, I’d use color-coding to differentiate between different network segments, use different line thicknesses to emphasize primary vs. secondary connections, and group individual servers into logical clusters. Careful use of visual cues greatly enhances the diagram’s understandability.
Q 27. How do you ensure your diagrams are effectively communicated to stakeholders?
Effective communication is the ultimate goal of any diagram. To ensure that my diagrams communicate effectively, I begin by understanding my audience. What’s their level of technical expertise? What are their specific needs and expectations? Then, I tailor my diagram’s complexity and presentation style accordingly. I ensure that the diagram is self-explanatory, with clear labels and annotations. I use visual aids and visual metaphors where appropriate to enhance understanding. Finally, I provide contextual explanation during presentations or meetings, answering questions and clarifying any ambiguities. I also encourage interaction and feedback during these presentations to ensure everyone is on the same page.
For example, when presenting a flowchart to senior management, I’d focus on the high-level process flow, using simple language and avoiding technical jargon. When presenting the same flowchart to the technical team, I’d go into more detail, highlighting specific technical aspects.
Q 28. How do you integrate diagrams into broader documentation or project deliverables?
Integrating diagrams seamlessly into broader documentation and project deliverables requires careful planning and execution. I use the export functionality in OmniGraffle and Visio to create high-quality images (PNG, JPG, SVG) or PDFs that can be easily embedded into other documents (e.g., Word, PowerPoint, Confluence). I also maintain version control using tools like Git to track changes and collaborate effectively. For larger documents, I leverage a well-organized file structure to make finding and linking specific diagrams easy. Furthermore, I ensure the diagrams are properly captioned and referenced within the broader documentation, clearly indicating their purpose and context. I also provide cross-referencing to relevant sections of text.
For instance, in a software design document, I would embed Visio diagrams illustrating the system architecture, component interactions, and data flows, all correctly referenced and labeled. This ensures consistency and easy navigation within the entire document.
Key Topics to Learn for OmniGraffle/Visio Interview
- Interface and Navigation: Mastering the user interface, including toolbars, menus, and palettes, is crucial for efficient diagramming. Practice navigating and utilizing features quickly and effectively.
- Shape Manipulation and Customization: Understand how to create, modify, and customize shapes. This includes resizing, rotating, layering, and applying styles to achieve professional-looking diagrams.
- Mastering Connectors and Relationships: Learn how to effectively connect shapes to represent relationships and flows in your diagrams. Practice creating clean and understandable connections.
- Smart Shapes and Stencils: Familiarize yourself with pre-built shapes and stencils. Understand how to leverage them to increase efficiency and consistency in your diagrams.
- Layering and Grouping: Learn to organize complex diagrams using layers and grouping. This is essential for managing and editing large and intricate projects.
- Text and Annotation: Practice adding clear and concise text annotations to your diagrams. Understand how to format text for readability and visual appeal.
- Exporting and Sharing: Learn different export options to share your diagrams in various formats (e.g., PDF, PNG, SVG). Understand the advantages and disadvantages of each format.
- Collaboration and Version Control (if applicable): If the role involves collaborative diagramming, familiarize yourself with features related to shared workspaces and version control.
- Diagram Best Practices: Research and understand established best practices for creating clear, concise, and effective diagrams in OmniGraffle/Visio. This includes principles of visual communication and information architecture.
- Troubleshooting and Problem-Solving: Practice identifying and resolving common issues encountered while working with OmniGraffle/Visio. Be prepared to discuss your approach to problem-solving in a technical context.
Next Steps
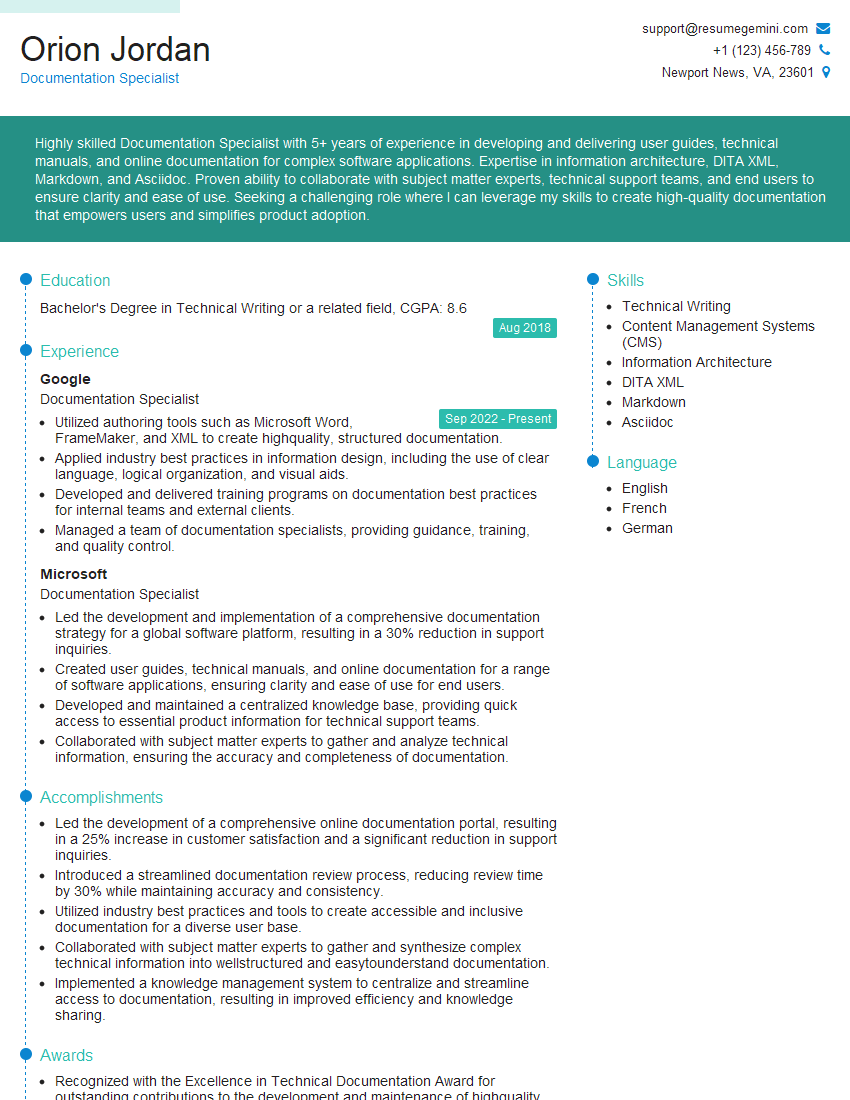
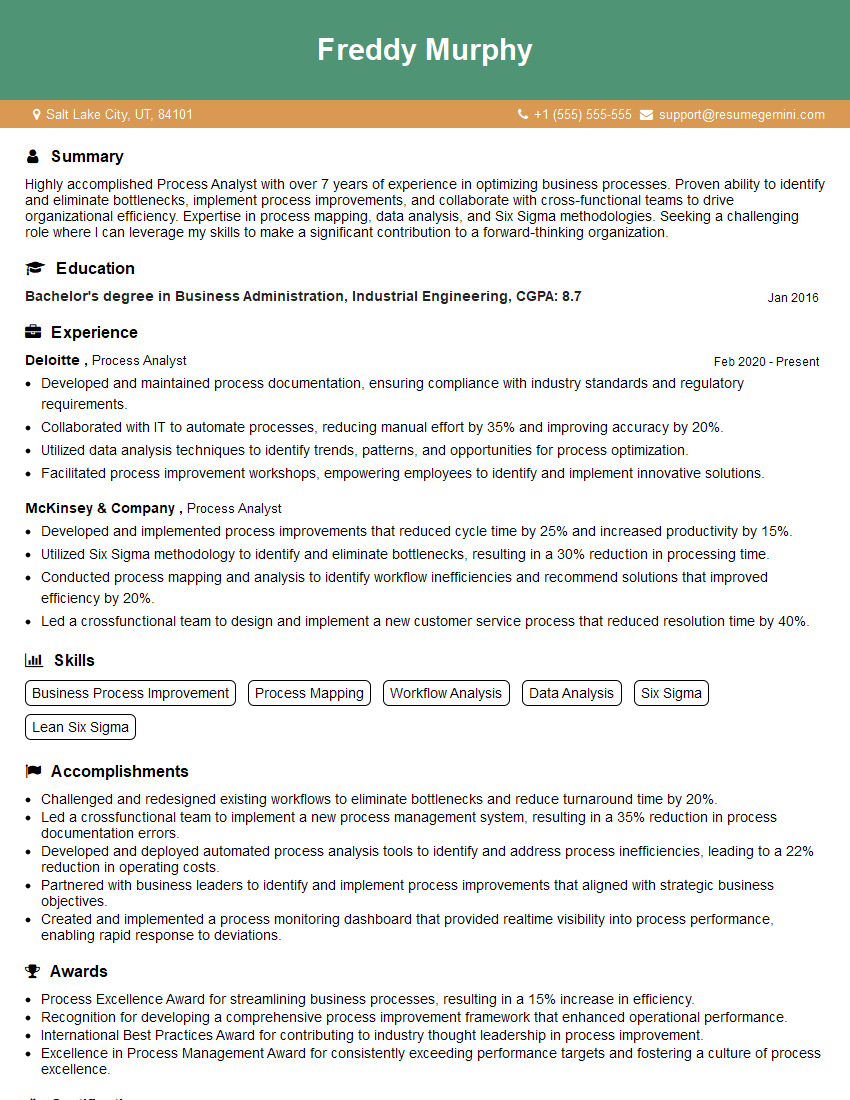
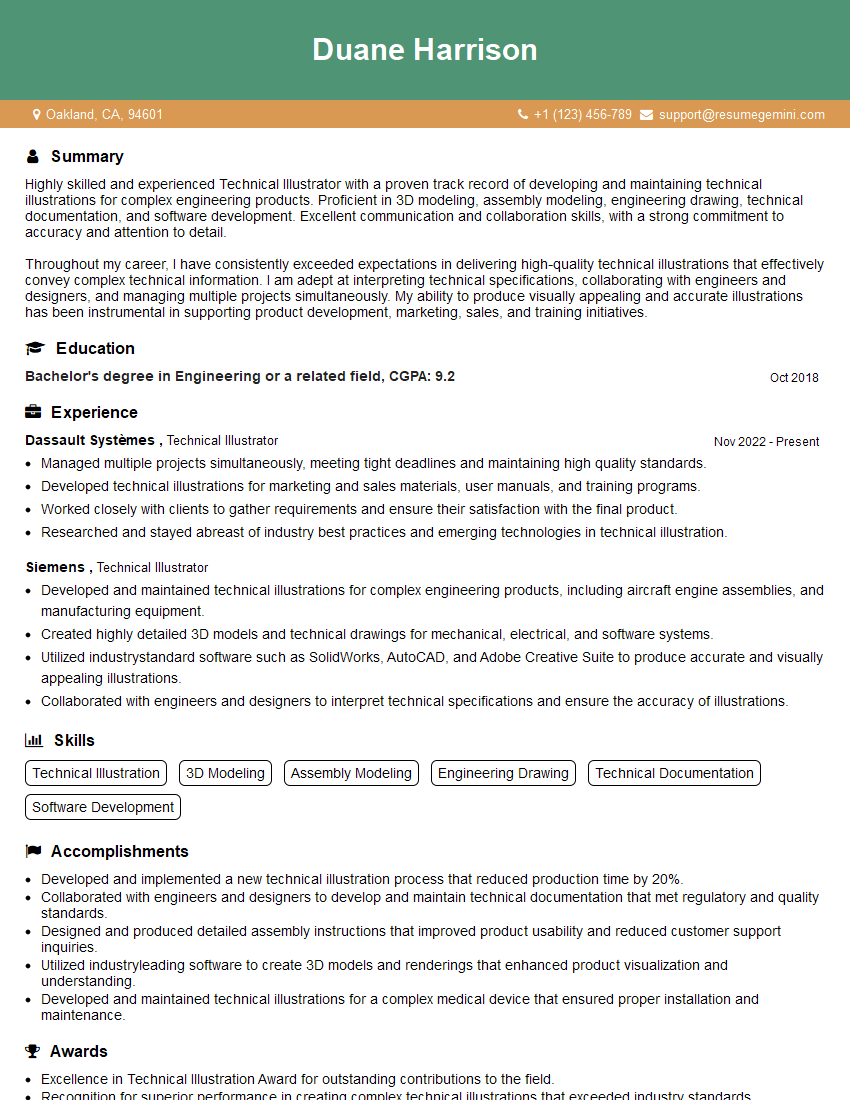
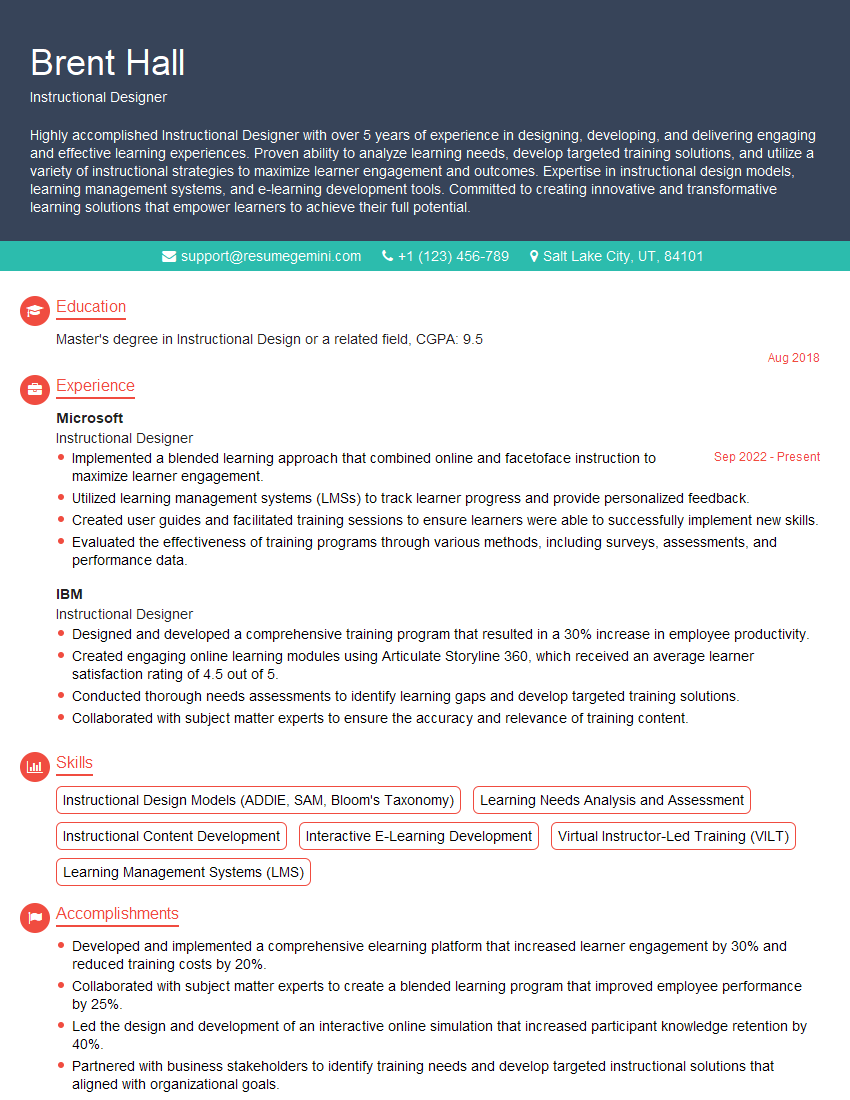
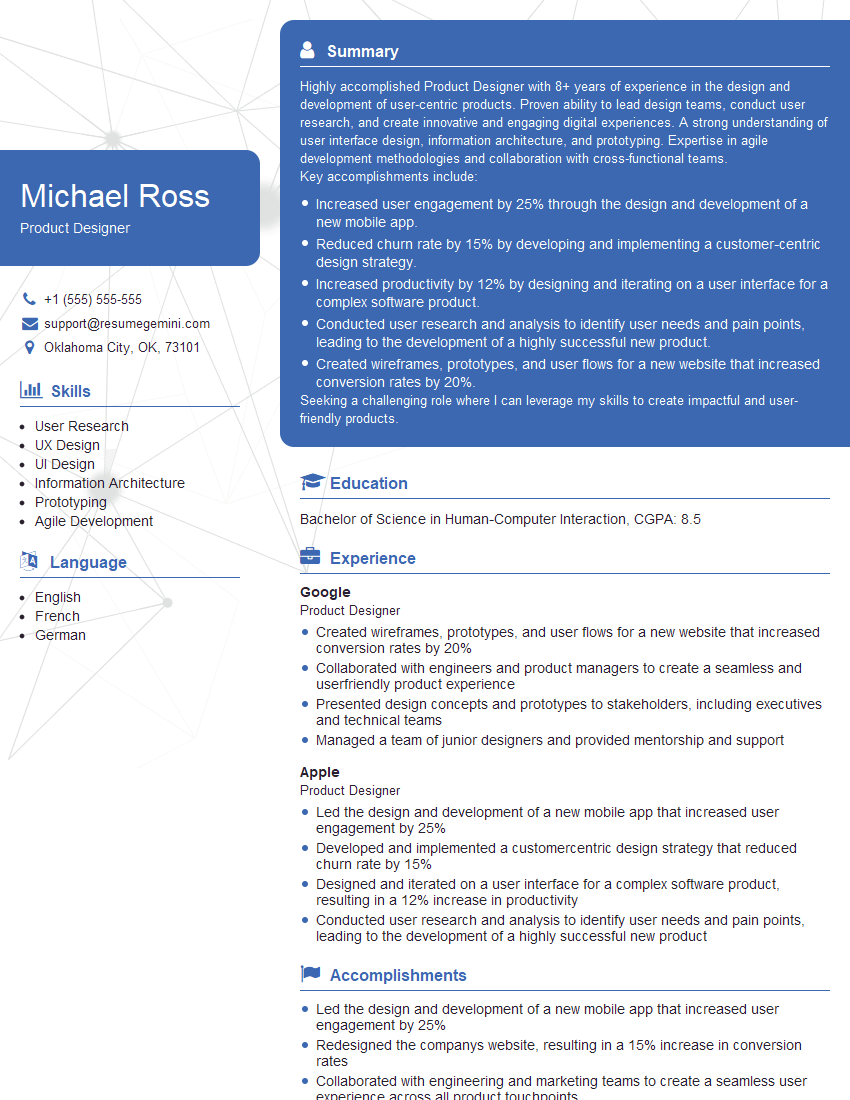
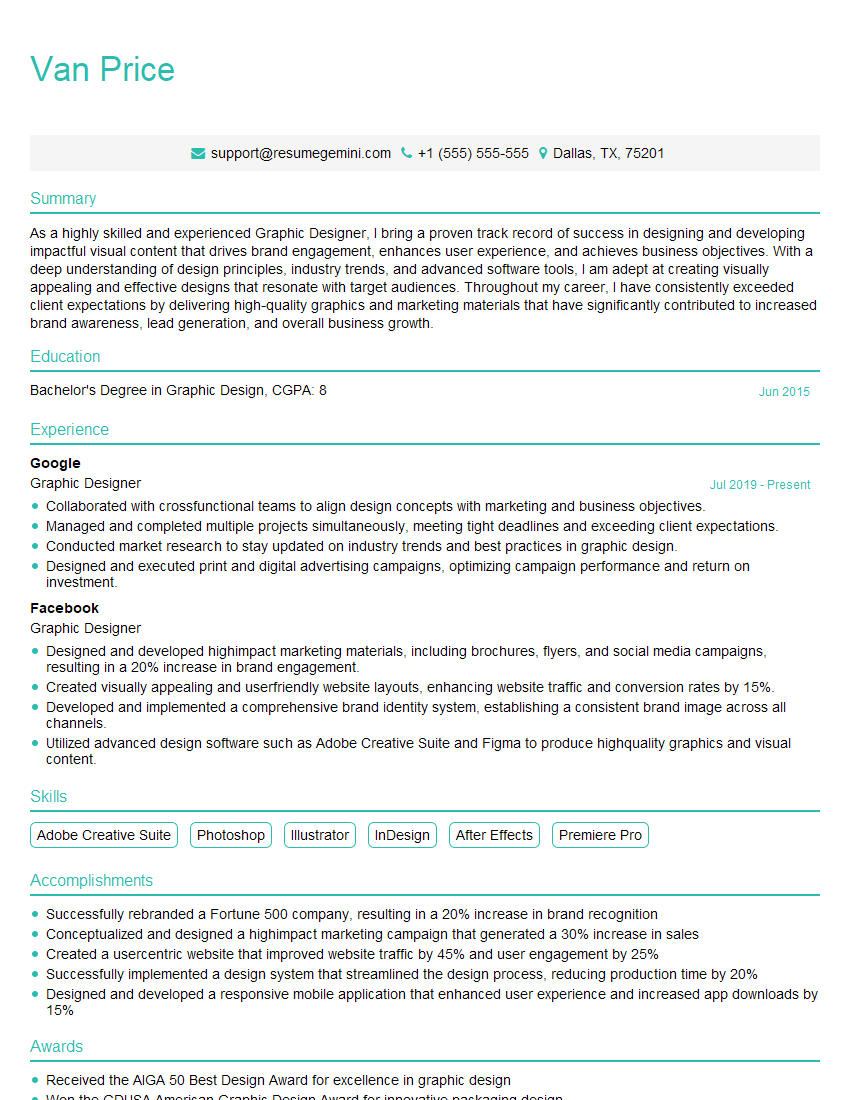
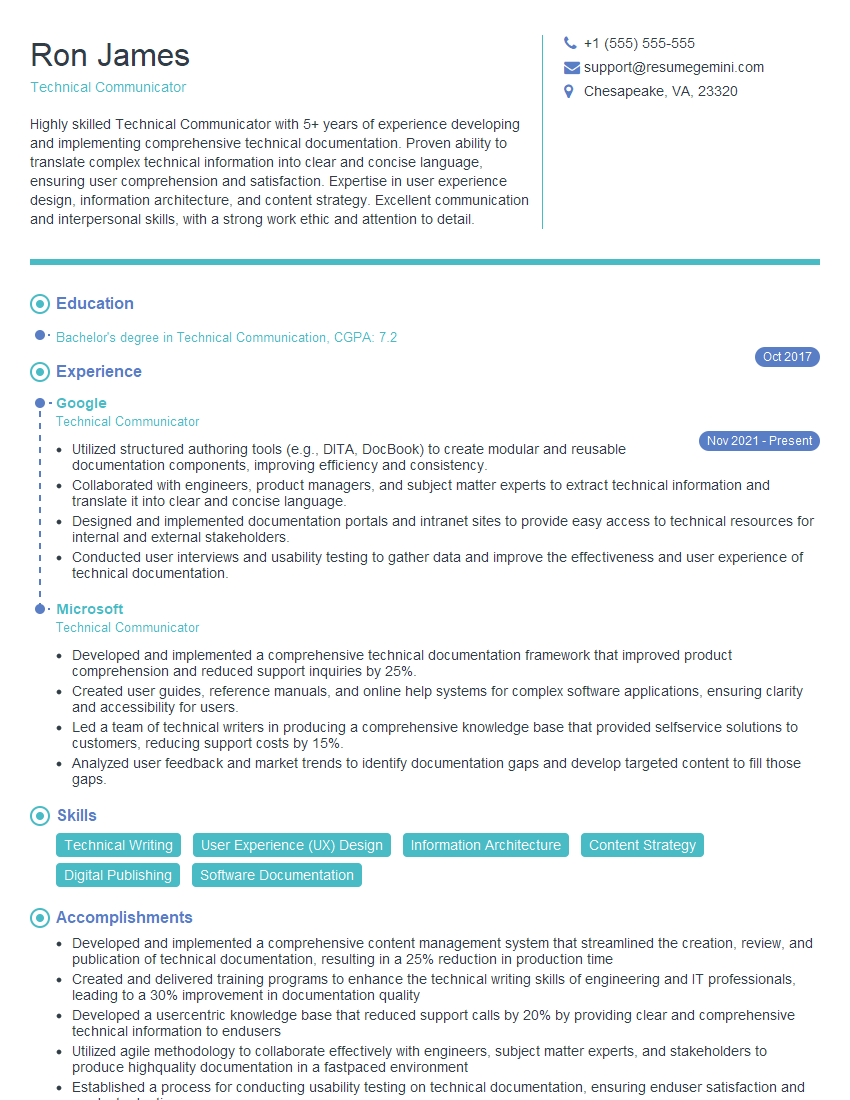
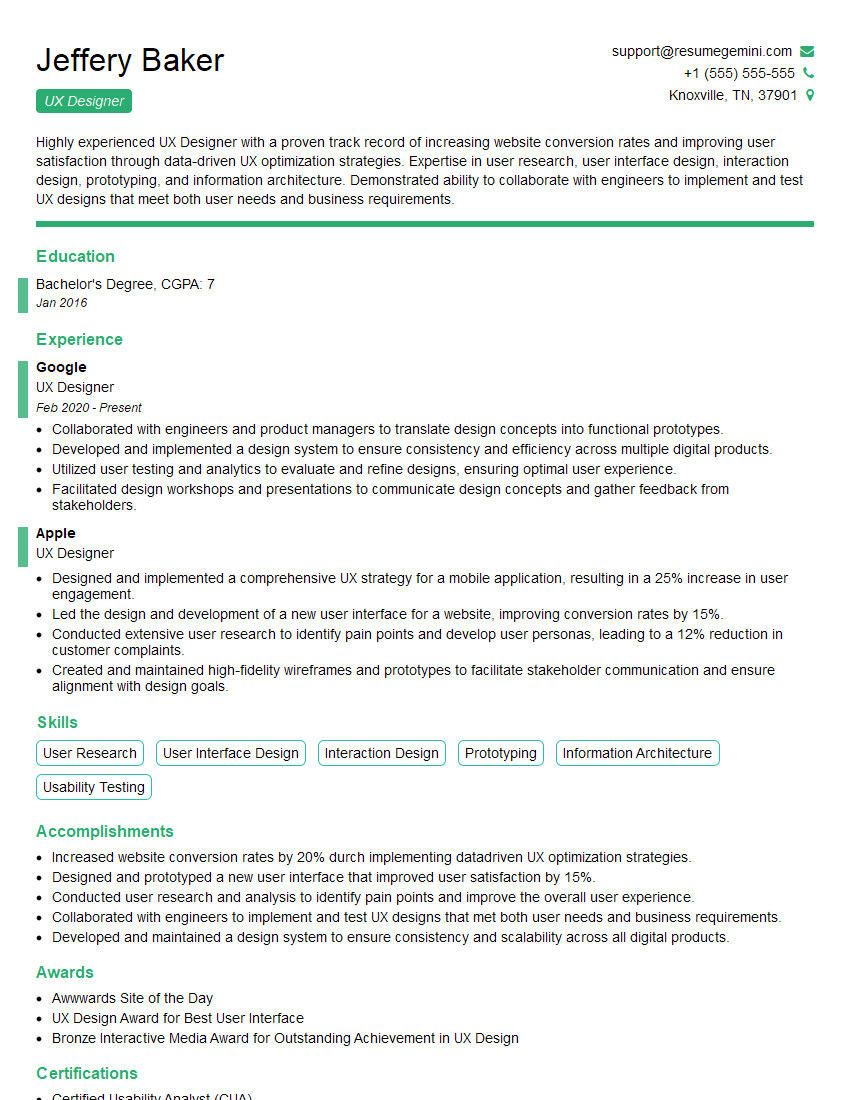
Proficiency in OmniGraffle/Visio is a highly sought-after skill that significantly enhances your career prospects in many fields, including software development, project management, and technical writing. To maximize your job search success, it’s crucial to build an ATS-friendly resume that effectively showcases your abilities. We strongly encourage you to leverage ResumeGemini, a trusted resource for crafting compelling and effective resumes. ResumeGemini provides examples of resumes tailored to OmniGraffle/Visio roles, helping you present your skills and experience in the best possible light. Take the next step towards your dream job by creating a resume that stands out.
Explore more articles
Users Rating of Our Blogs
Share Your Experience
We value your feedback! Please rate our content and share your thoughts (optional).
What Readers Say About Our Blog
Take a look at this stunning 2-bedroom apartment perfectly situated NYC’s coveted Hudson Yards!
https://bit.ly/Lovely2BedsApartmentHudsonYards
Live Rent Free!
https://bit.ly/LiveRentFREE
Interesting Article, I liked the depth of knowledge you’ve shared.
Helpful, thanks for sharing.
Hi, I represent a social media marketing agency and liked your blog
Hi, I represent an SEO company that specialises in getting you AI citations and higher rankings on Google. I’d like to offer you a 100% free SEO audit for your website. Would you be interested?


