Interviews are more than just a Q&A session—they’re a chance to prove your worth. This blog dives into essential Statistical Process Control (SPC) for Manufacturing interview questions and expert tips to help you align your answers with what hiring managers are looking for. Start preparing to shine!
Questions Asked in Statistical Process Control (SPC) for Manufacturing Interview
Q 1. Explain the purpose of Statistical Process Control (SPC).
Statistical Process Control (SPC) is a powerful set of tools used in manufacturing and other industries to monitor and improve the quality of processes. Its primary purpose is to detect and prevent defects by identifying sources of variation in a process. Think of it as a proactive approach to quality management, allowing you to spot problems *before* they lead to large-scale issues and customer dissatisfaction. Instead of reacting to problems after they’ve occurred, SPC helps you monitor a process continuously, making small adjustments to keep it within acceptable limits.
By continuously tracking key process characteristics, SPC enables early identification of shifts in process performance. This allows for timely interventions and minimizes the production of defective products, saving time, materials, and resources.
Q 2. Describe the different types of control charts and when to use each.
Several types of control charts exist, each designed for specific data types. The choice depends on the nature of the data you’re collecting.
- X-bar and R chart: Used for continuous data (e.g., weight, length, temperature) when you’re measuring the average (X-bar) and range (R) of subgroups of samples. This is a very common chart for monitoring process averages and variability simultaneously.
- X-bar and s chart: Similar to X-bar and R, but uses the standard deviation (s) instead of the range. Generally preferred for larger subgroup sizes (n>10) because it’s more statistically efficient.
- Individuals and Moving Range (I-MR) chart: Used for continuous data when individual measurements are taken rather than subgroups. This is useful when sampling is expensive or time-consuming.
- p-chart: Used for attribute data (e.g., number of defects) expressed as a proportion or percentage of nonconforming units in a sample.
- np-chart: Similar to p-chart but tracks the actual number of nonconforming units rather than the proportion. Useful when the sample size is constant.
- c-chart: Used for attribute data representing the number of defects per unit. Useful for monitoring defects in a continuous process (e.g., the number of scratches on a painted surface).
- u-chart: Used for attribute data expressing the number of defects per unit when the sample size varies.
The selection process involves careful consideration of the data type and the goals of your process monitoring. For example, if you’re monitoring the weight of packaged goods, an X-bar and R chart would be appropriate, whereas if you’re monitoring the number of blemishes on a painted panel, a c-chart would be the better choice.
Q 3. How do you interpret a control chart? Explain the meaning of points outside control limits.
Interpreting a control chart involves looking for patterns and deviations from expected behavior. The control limits (usually set at three standard deviations from the centerline) define the acceptable range of variation for the process.
Points outside the control limits indicate that the process is out of statistical control. This suggests the presence of special causes of variation, which need immediate investigation. These points are not simply random fluctuations; they signal a significant change in the process. This could be due to factors like machine malfunction, operator error, changes in materials, or environmental changes. A thorough investigation is crucial to identify the root cause and implement corrective actions.
Other indicators of out-of-control situations include runs (sequences of points consistently above or below the centerline), trends (points consistently increasing or decreasing), and other non-random patterns. These may also suggest the presence of assignable causes requiring investigation, even if individual points remain within the control limits.
Let’s say we’re monitoring the diameter of a manufactured part using an X-bar and R chart. If a point falls outside the upper control limit, it signifies that the average diameter is significantly larger than expected and requires immediate attention to prevent the production of oversized and potentially unusable parts.
Q 4. What are common causes and special causes of variation?
Variations in a process can be categorized into two main types: common causes and special causes.
- Common causes of variation are inherent in the process and are always present. They are small, random fluctuations that are considered normal and are part of the natural variability of the system. These variations are often difficult and costly to eliminate completely. Think of the minor variations in temperature or humidity that affect a manufacturing process.
- Special causes of variation are not inherent in the process; they are infrequent, large, and unpredictable variations that signal a problem. These are “assignable causes” that need to be identified and addressed. Examples include machine malfunction, improper operator training, or a change in the raw materials.
Understanding the distinction is vital for effective process improvement. Addressing common causes requires systemic changes to improve the process, whereas special causes require finding and fixing the specific issue causing the variation. Ignoring special causes can lead to defective products and inefficient processes, while obsessing over minor common cause variations is generally unproductive.
Q 5. Explain the concept of process capability and how it’s measured (Cp, Cpk).
Process capability refers to the ability of a process to consistently produce output that meets pre-defined specifications. It’s a measure of how well a process performs relative to its requirements. Think of it as how well your process conforms to the customer’s or industry’s standards.
Process capability indices, such as Cp and Cpk, quantitatively assess the process capability. They compare the process’s natural variation to the tolerance limits specified by the customer or standards.
- Cp (Process Capability Index): Measures the potential capability of a process assuming the process is centered on the target value. It only assesses the spread of the process relative to the specification limits, ignoring the process center.
- Cpk (Process Capability Index): Measures the actual capability of a process, considering both the spread of the process and its centering relative to the target value. It gives a more realistic picture of how well the process is meeting the specifications.
A higher Cp and Cpk value indicates a more capable process. Generally, values above 1.33 are considered desirable in many industries. These indices provide a clear picture of whether your process is producing products within the required specifications and helps identify areas needing improvement. This leads to more efficient processes and higher customer satisfaction.
Q 6. How do you calculate Cp and Cpk?
The calculation of Cp and Cpk involves the process mean (x̄), the standard deviation (σ), the upper specification limit (USL), and the lower specification limit (LSL).
Cp Calculation:
Cp = (USL - LSL) / (6σ)
Cpk Calculation:
Cpk = min[(USL - x̄) / (3σ), (x̄ - LSL) / (3σ)]
Where:
- USL = Upper Specification Limit
- LSL = Lower Specification Limit
- x̄ = Process Mean
- σ = Process Standard Deviation
The standard deviation (σ) is typically estimated from control chart data, specifically from the data used to create the control limits. It represents the natural variability inherent in the process. The values of USL and LSL are determined by design specifications or customer requirements. For example, if you’re manufacturing bolts that need to be between 10mm and 10.2mm in length, USL would be 10.2mm and LSL would be 10mm. In practice, the calculations often use estimated values for the population standard deviation (σ) based on sample data and control chart analysis.
Q 7. What is the difference between Cp and Cpk?
The key difference between Cp and Cpk lies in how they account for process centering.
Cp measures the *potential* capability of the process, assuming the process is perfectly centered (mean equals the target). It only considers the process variability. A high Cp value indicates that the process has the potential to meet the specifications but doesn’t guarantee it will actually do so.
Cpk measures the *actual* capability of the process by accounting for both the variability and the process centering. It indicates how well the process is performing *in reality*, taking into account how well the process mean is aligned with the target. A high Cpk value signifies that the process is both precise (low variability) and accurate (centered on the target).
In simple terms, Cp tells you whether your process *could* meet the specifications if perfectly centered, while Cpk tells you whether it *actually is* meeting the specifications given its current state. A process can have a high Cp but a low Cpk if it’s not centered correctly.
Q 8. What are the limitations of Cp and Cpk?
Cp and Cpk are process capability indices that measure how well a process is capable of meeting specifications. However, they have limitations. Cp, the process capability ratio, only considers the process spread relative to the specification width. It doesn’t account for process centering. A process could have a high Cp but still produce many out-of-spec parts if it’s not centered on the target. Cpk, the process capability index, addresses this by considering both process spread and centering. However, both Cp and Cpk rely on the assumption of normality. If your data isn’t normally distributed, these indices can be misleading. Furthermore, they are static measures – a snapshot in time. They don’t reflect process variation over time, which is crucial for understanding process stability. Finally, they don’t directly account for other factors affecting quality, such as defects that aren’t captured by simple measurement variation.
Example: Imagine a process producing bolts with a target diameter of 10mm and a tolerance of ±0.1mm. If the process has a standard deviation of 0.02mm and is perfectly centered, Cp will be high. However, if the process mean shifts slightly to 10.05mm, many bolts will be out of spec, despite a potentially high Cp. Cpk will reflect this poor centering, but it still assumes normality and provides only a snapshot in time.
Q 9. Explain the concept of Six Sigma.
Six Sigma is a data-driven methodology aimed at minimizing defects and variation in any process. It strives for near-perfection, aiming for a defect rate of 3.4 defects per million opportunities (DPMO). This translates to a process capability of 6 standard deviations between the mean and the nearest specification limit. Six Sigma utilizes a structured problem-solving approach (DMAIC: Define, Measure, Analyze, Improve, Control) combined with statistical tools like control charts, to identify and eliminate root causes of variation and defects. The core philosophy is to understand and reduce variation to improve process predictability and efficiency.
Example: A company manufacturing electronics might use Six Sigma to reduce the number of faulty circuit boards. The DMAIC approach would guide the team through defining the problem (high defect rate), measuring the current defect rate, analyzing the sources of defects, implementing improvements (e.g., new equipment, improved training), and controlling the process to maintain the improved performance over time. Control charts would monitor key process parameters to ensure continuous improvement and prevent future issues.
Q 10. What is a Pareto chart and how is it used in SPC?
A Pareto chart is a bar graph that ranks causes of problems from most significant to least significant. It visually displays the ‘vital few’ and the ‘trivial many’, illustrating the principle that 80% of problems often stem from 20% of the causes (the Pareto principle). In SPC, it helps identify the major contributors to process variation and defects, allowing for focused improvement efforts. The chart displays both bars representing the frequency of each cause and a line representing the cumulative frequency.
Example: A factory experiencing high rates of product defects might use a Pareto chart to analyze the root causes. Suppose the chart reveals that 60% of defects are due to improper material handling, 25% to machine malfunction, and 15% to operator error. This prioritizes efforts on improving material handling, as it’s the most impactful area for defect reduction.
Q 11. What is a fishbone diagram and how is it used in root cause analysis?
A fishbone diagram, also known as an Ishikawa diagram or cause-and-effect diagram, is a visual tool used in root cause analysis. It organizes potential causes of a problem into categories, typically brainstorming various factors that contribute to the effect (the problem). This systematic approach helps teams identify and explore potential root causes rather than focusing only on surface-level symptoms. Branches extending from the central ‘fishbone’ represent different categories like materials, methods, manpower, machinery, measurement, and environment (the 6 Ms). Each branch is further broken down into specific causes.
Example: If a manufacturing process is producing too many defective parts, a fishbone diagram could help identify potential causes. The ‘head’ of the fish would represent the effect (‘high defect rate’). Branches could explore issues with raw materials, machine settings, operator skills, maintenance practices, measurement tools, and environmental conditions. The team would brainstorm specific causes under each branch, leading to a detailed understanding of potential root causes.
Q 12. Describe the steps involved in a typical SPC implementation.
A typical SPC implementation involves several key steps:
- Define the process: Clearly define the process to be monitored, including its objectives and critical parameters. This sets a clear scope for your SPC efforts.
- Identify critical parameters: Determine the key characteristics of the process that significantly impact its quality. This selection guides your data collection and analysis.
- Establish control limits: Gather data from the process, ensuring sufficient sample size, and calculate control limits based on statistical methods (e.g., using averages and ranges). This establishes the baseline performance of your process.
- Develop control charts: Choose the appropriate control chart (e.g., X-bar and R chart, p-chart, c-chart) based on the type of data. Control charts visually track process performance over time, allowing you to detect shifts in the process mean or variation.
- Monitor and analyze data: Continuously monitor the process using the control charts, paying attention to patterns or trends that indicate out-of-control conditions. Investigate any points outside control limits or non-random patterns to identify potential causes.
- Implement corrective actions: When issues are identified, implement corrective actions to address the root causes and bring the process back into control. This might involve machine adjustments, operator training, or process improvements.
- Continuously improve: Regularly review the process and control charts to identify opportunities for further improvement. SPC is not just about detecting problems but also about proactively preventing them and striving for continuous improvement.
Q 13. How do you handle outliers in your data?
Handling outliers requires careful consideration. Simply removing outliers without investigation is risky and could mask important information. The first step is to investigate the cause of the outlier. Is it due to a measurement error, a temporary process upset, or a genuine shift in the process? If it’s a measurement error, the data point is discarded. If it’s a temporary process upset (like a machine malfunction), it might be excluded from the analysis only for determining control limits. If it’s a genuine process shift, it signals a need for root cause analysis and process improvement. Robust statistical methods less sensitive to outliers, like median instead of mean, can be used in some cases. Box plots or scatter plots can help visually identify them.
Example: If a control chart shows a single data point far outside the control limits, it’s necessary to investigate the production records at that specific time. Was there a machine problem? Was there a change in raw materials? If the outlier is due to a known temporary problem, the data point might be excluded only from the analysis of the overall process capability. But if a systematic root cause is found, that needs to be corrected and the process recalibrated.
Q 14. How do you determine the appropriate sample size for SPC?
Determining the appropriate sample size for SPC depends on several factors: the desired level of precision, the process variability, the frequency of sampling, and the cost of sampling. Larger sample sizes provide greater precision but increase the cost and time. A smaller sample size may not detect small shifts in the process. There’s no single ‘right’ answer, but a balanced approach is essential. Statistical power analysis can be employed to determine a sample size that offers a good balance between precision and practicality. Consider the cost-benefit tradeoff when designing your sampling plan, aiming for a balance between detecting meaningful changes and minimizing resources. Some industries and standards might offer guidance on suitable sample sizes. Pilot studies can help estimate process variability which is a crucial input to sample size determination.
Example: If a process has high variability and detecting small shifts is critical, a larger sample size is necessary. However, if the process is stable with low variability, a smaller sample size might suffice. Pilot runs are typically employed to get preliminary estimates for process variability and then use statistical software to calculate the appropriate sample size based on parameters such as acceptable Type I and Type II errors.
Q 15. What are some common SPC software packages?
Several software packages are available for Statistical Process Control (SPC). The choice often depends on the specific needs of the user and the scale of the operation. Some popular options include:
- Minitab: A widely used statistical software package with extensive SPC capabilities, including various control chart types, capability analysis, and other statistical tools. It’s known for its user-friendly interface and comprehensive features.
- JMP: Another powerful statistical software package from SAS, JMP provides strong SPC functionality, interactive visualizations, and a streamlined workflow, particularly well-suited for exploratory data analysis.
- SigmaXL: A more cost-effective add-in for Microsoft Excel, SigmaXL offers a good range of SPC tools and is accessible to users familiar with Excel. It’s a great option for smaller businesses or those who prefer to work within the Excel environment.
- QI Macros: Similar to SigmaXL, QI Macros is an Excel add-in specializing in SPC and quality improvement tools. It often features user-friendly templates and reporting capabilities.
- SPC software integrated into Manufacturing Execution Systems (MES): Many modern MES platforms incorporate SPC capabilities directly into their dashboards, providing real-time process monitoring and automated alerts. This integrates seamlessly with the manufacturing environment.
The best software will depend on factors such as budget, existing software infrastructure, the complexity of your processes, and the level of statistical expertise within your team.
Career Expert Tips:
- Ace those interviews! Prepare effectively by reviewing the Top 50 Most Common Interview Questions on ResumeGemini.
- Navigate your job search with confidence! Explore a wide range of Career Tips on ResumeGemini. Learn about common challenges and recommendations to overcome them.
- Craft the perfect resume! Master the Art of Resume Writing with ResumeGemini’s guide. Showcase your unique qualifications and achievements effectively.
- Don’t miss out on holiday savings! Build your dream resume with ResumeGemini’s ATS optimized templates.
Q 16. Describe your experience with control chart software.
I have extensive experience with various control chart software packages, including Minitab, JMP, and SigmaXL. My experience encompasses data input, control chart construction (X-bar and R, X-bar and s, p-charts, c-charts, etc.), interpretation of control charts to identify special cause variation and common cause variation, and generating reports for both technical and non-technical audiences. I am proficient in using software to perform capability analysis (Cp, Cpk) and other process performance metrics. I’ve also used software to automate data collection and control chart updates, integrating SPC directly into our manufacturing workflows. For instance, in a previous role, I implemented an automated system using Minitab and an MES system to track key process parameters in real-time, instantly notifying operators of out-of-control conditions.
Beyond the specific software, my experience includes developing custom macros and scripts to enhance efficiency and automate repetitive tasks. I’m also comfortable adapting to new software as needed, learning quickly to leverage its capabilities effectively.
Q 17. How do you communicate SPC results to non-technical audiences?
Communicating SPC results to non-technical audiences requires a clear and concise approach, avoiding statistical jargon as much as possible. I typically use a combination of techniques:
- Visualizations: Control charts themselves are visual tools. I focus on highlighting key aspects – trends, points outside control limits, and overall process stability – rather than dwelling on the statistical calculations behind them. Simple visuals like bar graphs summarizing key metrics also work well.
- Analogies and Stories: Instead of saying “the process is out of statistical control,” I might say, “Imagine a car going 5 mph over the speed limit consistently. That’s consistent but still wrong.” This makes the concept more relatable.
- Focus on the “So What?”: I always connect the SPC results back to the business impact. For example, if a process is unstable, I explain how that affects production costs, customer satisfaction, or defect rates, directly relating it to bottom-line results.
- Summary Reports: I create concise summary reports with clear, actionable recommendations. These reports use plain language and highlight the key findings and proposed solutions without delving into complex statistical details.
- Interactive Presentations: A visual presentation, where I can explain the charts and their implications interactively, often increases understanding and engagement.
The goal is not to impress with statistical knowledge, but to ensure everyone understands the implications of the data and what actions are needed.
Q 18. Explain the difference between X-bar and R charts and X-bar and s charts.
Both X-bar and R charts and X-bar and s charts are used for monitoring the central tendency and variability of a process, typically for continuous data. However, they differ in how they measure and handle variability:
- X-bar and R charts: These charts use the range (R) of the data within a subgroup to estimate variability. The range is the difference between the highest and lowest values in a subgroup. This method is simpler to calculate but less statistically efficient than using standard deviation, especially for larger subgroups.
- X-bar and s charts: These charts use the sample standard deviation (s) of the data within each subgroup to measure variability. The standard deviation is a more precise measure of variability compared to the range, providing a more sensitive indication of changes in process dispersion. Standard deviation charts provide greater statistical power and are better for detecting smaller shifts in variability.
In practice, X-bar and R charts are often preferred for smaller subgroups (typically n ≤ 10) due to their simplicity, while X-bar and s charts are preferred for larger subgroups (n > 10) because they offer greater precision in estimating variability. The choice depends on the subgroup size and the desired sensitivity to process variation.
Q 19. What is a moving range chart and when would you use it?
A moving range chart is a control chart used to monitor the variability of a process when subgroups of size one are used for data collection. Since we don’t have multiple data points within a subgroup to calculate the range directly, the moving range is calculated as the absolute difference between consecutive data points. For example, if you have data points 10, 12, 11, and 13, the moving ranges would be |12-10|=2, |11-12|=1, and |13-11|=2.
You’d use a moving range chart when you’re collecting individual measurements rather than subgroups of data. This is common when:
- The process is slow or infrequent, making subgrouping difficult.
- Data is expensive or time-consuming to collect, limiting the number of data points.
- Measuring the actual process output is not feasible during production and you rely on the final product measure.
The moving range chart is paired with an individuals chart (often just called an ‘I-chart’) to track the average value. The moving range chart complements the individuals chart by providing information about the process variability.
Q 20. How do you determine if a process is stable?
Determining if a process is stable involves a thorough examination of its control charts. A stable process exhibits only common cause variation, which is inherent to the process and is considered predictable within reasonable limits. To determine stability, I check for the following:
- Points Outside Control Limits: The most obvious sign of instability is any points falling outside the upper or lower control limits (UCL and LCL) of the control chart. These points indicate special cause variation, meaning there’s an assignable cause affecting the process.
- Trends: A consistent upward or downward trend in the data points, even if within the control limits, suggests instability. This shows a systematic shift in the process, which should be investigated.
- Stratification or Clustering: Data points may cluster in certain areas within the control limits, suggesting hidden factors affecting the process behavior.
- Cycles: Recurring patterns of data points may indicate periodic influences (e.g., daily or weekly fluctuations).
- Runs: A series of consecutive points above or below the central line (centerline) can indicate a shift in the process, even if not beyond the control limits. Rules for determining a statistically significant run are well-established.
If any of these are present, the process is considered unstable, and further investigation is needed to identify and eliminate the special causes of variation. Only once these special causes are addressed can the process be truly deemed stable and predictable.
Q 21. Describe a time you identified a process improvement opportunity using SPC.
In a previous role, we were experiencing high defect rates in a plastic injection molding process. Using SPC, specifically X-bar and R charts, we monitored key parameters like the clamping force and injection pressure. The X-bar chart initially showed points consistently within the control limits, but the R chart revealed increasing variability over time. This indicated that although the average values were within specification, the process was becoming less predictable.
Further investigation revealed that the aging of the injection mold was the root cause of the increasing variability. The wear on the mold was subtly impacting the consistency of the plastic parts. As a result, we implemented a preventative maintenance schedule for the molds, including regular inspections and replacements when necessary. This resulted in a significant reduction in process variability and a dramatic decrease in defect rates, leading to substantial cost savings and improved customer satisfaction.
This example highlighted the importance of monitoring process variability alongside the average. While the X-bar chart might have initially indicated a stable process, the R chart revealed an issue that needed attention. By understanding and correctly interpreting SPC data, we were able to pinpoint a hidden problem and implement a practical solution.
Q 22. What are some common challenges in implementing SPC?
Implementing Statistical Process Control (SPC) in manufacturing often faces hurdles. These challenges can be broadly categorized into data-related issues, human factors, and technological limitations.
- Data Acquisition and Accuracy: Gathering reliable and consistent data can be difficult. Inaccurate measurements, missing data points, or inconsistent recording practices significantly compromise the effectiveness of SPC. Imagine trying to build a house on a shaky foundation – the results won’t be stable. Similarly, flawed data leads to inaccurate control charts and misleading conclusions.
- Resistance to Change: Employees accustomed to traditional methods might resist adopting new SPC procedures. They may feel the added paperwork or training is burdensome, hindering buy-in.
- Lack of Training and Understanding: Proper training is crucial. Without it, employees might misinterpret control charts, leading to incorrect decisions. It’s like giving someone a complex tool without instructions – they won’t be able to use it effectively.
- Technological Limitations: Integrating SPC software with existing systems can be challenging, requiring significant investment and expertise. Data incompatibility and inadequate software functionalities are common problems.
- Defining Key Characteristics: Identifying the critical-to-quality (CTQ) characteristics that truly impact the end product and should be monitored requires careful consideration and expertise.
Q 23. How do you address resistance to change when implementing SPC?
Overcoming resistance to change when implementing SPC requires a multi-pronged approach focusing on communication, education, and demonstrating value. It’s about winning hearts and minds.
- Communication: Clearly explain the benefits of SPC, emphasizing improved quality, reduced waste, and increased efficiency. Use real-world examples to showcase successful SPC implementations in similar settings.
- Training and Education: Provide comprehensive training to all personnel involved, focusing on the practical application of SPC tools and techniques. Hands-on workshops and practical exercises make the learning process more engaging and effective.
- Demonstrating Value: Start with a pilot project on a smaller scale to demonstrate the positive impact of SPC before a full-scale rollout. This builds confidence and showcases tangible results that resonate with employees.
- Involve Employees: Involve employees in the implementation process. Seeking their input and incorporating their suggestions fosters a sense of ownership and reduces resistance. This collaborative approach makes them stakeholders in the success of SPC.
- Addressing Concerns: Actively listen to and address any concerns or anxieties that employees may have. Provide open communication channels for feedback and ensure that their voices are heard.
Q 24. How do you maintain SPC after initial implementation?
Maintaining SPC after initial implementation is a continuous process requiring ongoing commitment and refinement. Think of it like maintaining a well-oiled machine—it requires regular attention.
- Regular Monitoring and Review: Control charts should be monitored regularly to identify trends and potential problems. Periodic reviews of the SPC system’s effectiveness ensure continuous improvement.
- Data Integrity: Establish and maintain robust data management practices to guarantee data accuracy and reliability. This prevents flawed analysis and decisions.
- Training and Refresher Courses: Provide regular refresher courses and training to ensure all personnel remain proficient in using SPC tools and techniques. It is crucial to keep skills sharp.
- Process Improvements: Use the data gathered through SPC to identify and implement process improvements. This demonstrates the value of SPC and maintains employee engagement.
- Continuous Improvement Methodology: Integrate SPC with a broader continuous improvement framework, such as Lean or Six Sigma, to further enhance the effectiveness of the system.
Q 25. What are the key performance indicators (KPIs) you monitor in relation to SPC?
Key Performance Indicators (KPIs) for SPC focus on measuring the effectiveness of the process control and the overall impact on product quality. These are not just numbers; they represent the health of your production.
- Process Capability Indices (Cpk, Ppk): These metrics quantify the process’s ability to meet specifications. A higher Cpk/Ppk indicates better capability.
- Defect Rate: The percentage of non-conforming units produced. Lower is better, obviously.
- Number of Out-of-Control Points: This indicates the frequency of process instability and the need for corrective action. Aim for zero.
- Time to Detect Out-of-Control Conditions: A shorter time to detect problems minimizes the number of defective units produced.
- Reduction in Process Variation: Measuring the reduction in the standard deviation of the process over time shows the impact of SPC on process stability.
- Cost Savings: Quantifying the reduction in waste, rework, and scrap due to SPC demonstrates its financial benefits.
Q 26. How do you ensure data integrity in your SPC processes?
Data integrity is paramount in SPC. Inaccurate data renders the entire system useless. It’s like building a house with faulty blueprints—disaster is guaranteed.
- Data Acquisition Procedures: Establish clear and well-defined procedures for data collection, ensuring consistency and accuracy. This means using calibrated equipment and properly trained personnel.
- Data Verification and Validation: Implement mechanisms to verify and validate data, including regular audits and checks for inconsistencies. Data should be checked for outliers or errors.
- Data Storage and Management: Use secure and reliable systems for data storage and management, preventing loss or corruption of data. Data should be easily accessible and organized.
- Data Traceability: Maintain complete traceability of data, allowing for easy identification of the source and collection method. This allows for error correction and investigation.
- Secure Data Access Control: Implement appropriate access control mechanisms to protect the integrity and confidentiality of SPC data.
Q 27. Describe your experience with different types of sampling methods.
My experience encompasses various sampling methods, each with its strengths and weaknesses, chosen based on the specific process and objectives. Selecting the wrong method can severely skew your results.
- Random Sampling: Each unit in the population has an equal chance of being selected. This is ideal for homogeneous populations but can be inefficient for large populations.
- Stratified Sampling: The population is divided into subgroups (strata), and samples are randomly selected from each stratum. Useful when the population is heterogeneous and ensures representation from all subgroups.
- Systematic Sampling: Units are selected at a fixed interval (e.g., every 10th unit). Simple but can be biased if there’s a pattern in the data.
- Acceptance Sampling: A batch of units is inspected, and the entire batch is accepted or rejected based on the number of defective units found. Commonly used in incoming material inspection.
- Variable Sampling: Measurements of a continuous variable are taken (e.g., weight, length). This provides more information than attribute sampling but requires more sophisticated analysis.
- Attribute Sampling: Units are classified as conforming or non-conforming based on a specific attribute (e.g., pass/fail). Simpler to implement but provides less detailed information.
Q 28. Explain how you would use SPC to improve a specific manufacturing process.
Let’s say we’re improving a process for manufacturing plastic bottles. We’ve identified that the bottle’s weight is a critical quality characteristic. Here’s how I’d use SPC:
- Define Critical-to-Quality (CTQ) Characteristics: We’ve already identified bottle weight as CTQ. Other potential CTQs might include wall thickness and dimensions.
- Establish Measurement System: We need a precise and reliable scale calibrated regularly to measure bottle weight consistently.
- Collect Data: We’ll use a suitable sampling plan (e.g., random sampling) to collect weight data from a representative sample of bottles over time. The sampling frequency depends on the process stability and the potential for variation.
- Develop Control Charts: Based on the collected data, we would construct appropriate control charts (e.g., X-bar and R charts for averages and ranges). This visually displays the process behavior over time, highlighting any points outside control limits or patterns.
- Monitor and Analyze Data: Regularly monitor the control charts for any signs of process instability, such as shifts, trends, or out-of-control points. Investigate any unusual patterns or occurrences.
- Identify and Implement Corrective Actions: Based on the analysis, implement corrective actions to address any identified problems. This might involve machine adjustments, operator training, or material changes.
- Monitor and Repeat: Continue to monitor the process and refine our understanding of process stability and variability.
By using SPC, we can systematically identify and eliminate sources of variation, leading to a more stable and predictable process, resulting in consistently weighted bottles.
Key Topics to Learn for Statistical Process Control (SPC) for Manufacturing Interview
- Control Charts: Understanding different types (X-bar and R, X-bar and s, p, np, c, u), their construction, interpretation, and application in identifying process shifts and variations. Practical application: Analyzing control charts to determine if a manufacturing process is in control and identifying assignable causes of variation.
- Process Capability Analysis: Calculating Cp, Cpk, Pp, and Ppk indices. Understanding their significance in assessing process performance relative to customer specifications. Practical application: Determining if a process is capable of meeting customer requirements and identifying areas for improvement.
- Sampling Methods: Understanding different sampling techniques (random, stratified, systematic) and their impact on data accuracy and reliability. Practical application: Choosing the appropriate sampling method to ensure representative data collection for SPC analysis.
- Statistical Distributions: Familiarity with normal, binomial, and Poisson distributions and their applications in SPC. Practical application: Applying the appropriate statistical distribution to model process data and make inferences about process behavior.
- Hypothesis Testing: Understanding the principles of hypothesis testing and applying them to analyze process data and make informed decisions. Practical application: Using hypothesis testing to determine if observed process variations are statistically significant or due to random chance.
- Process Improvement Methodologies: Understanding Lean Manufacturing principles and their relationship to SPC. Practical application: Using SPC data to identify areas for process improvement and implementing solutions using Lean methodologies (e.g., DMAIC).
- Software Applications: Familiarity with statistical software packages (e.g., Minitab, JMP) used for SPC analysis. Practical application: Demonstrating proficiency in using statistical software to perform SPC analysis and create reports.
Next Steps
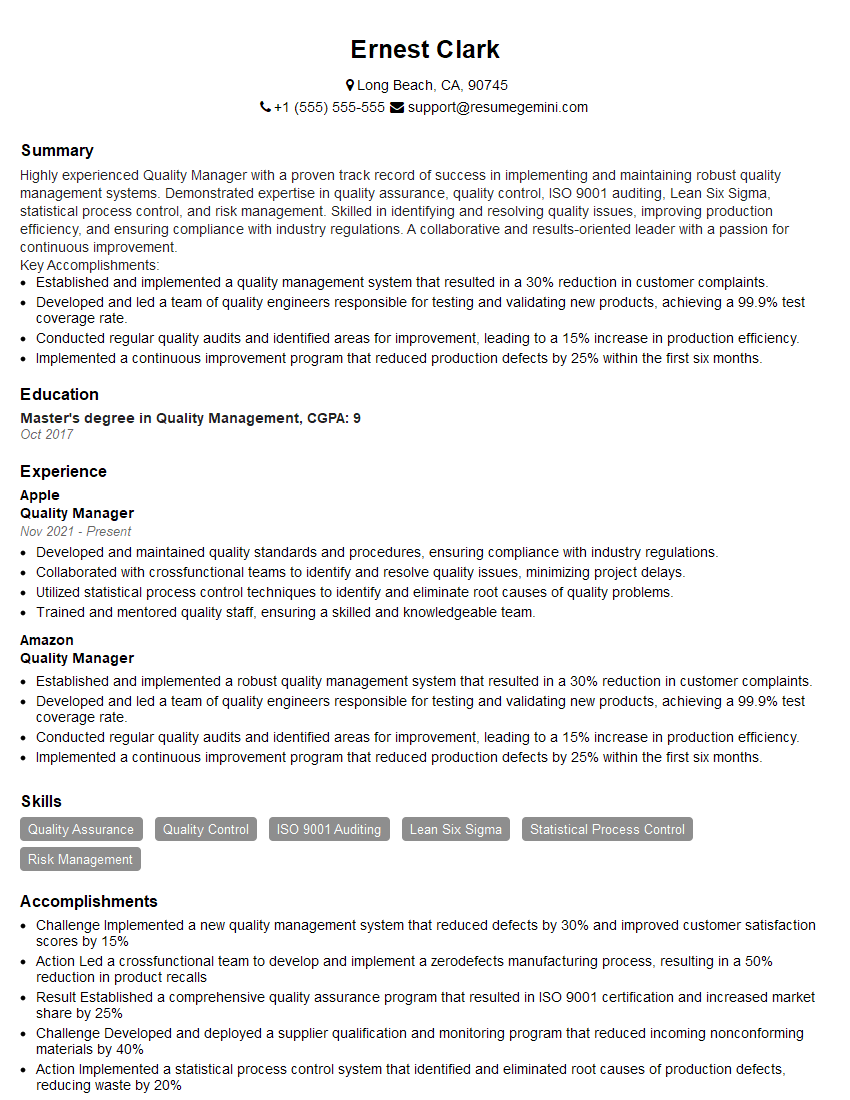
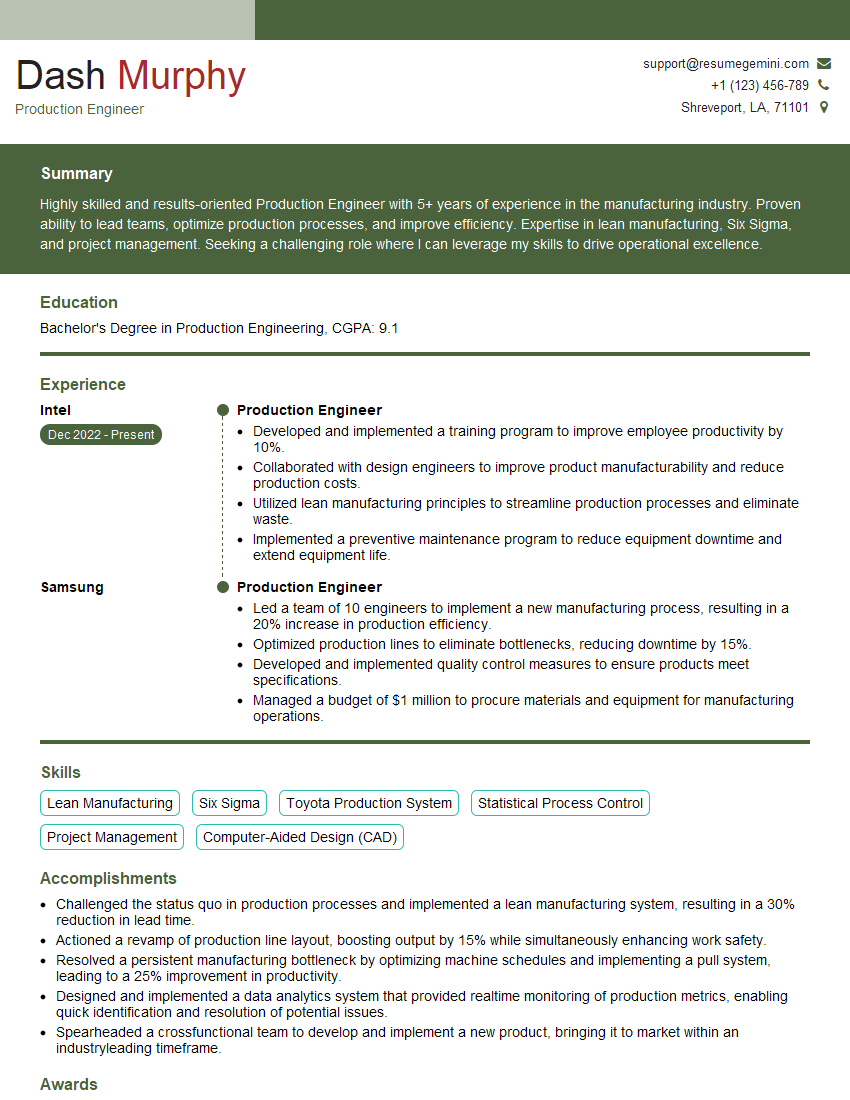
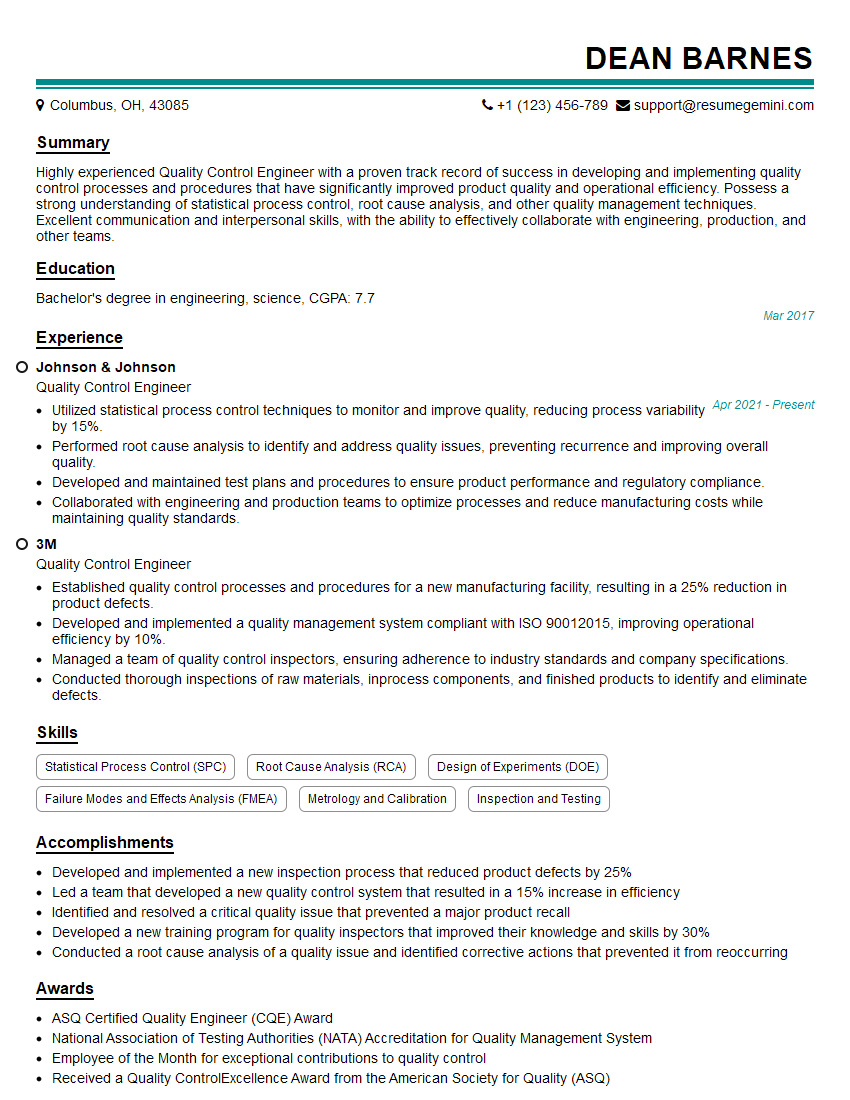
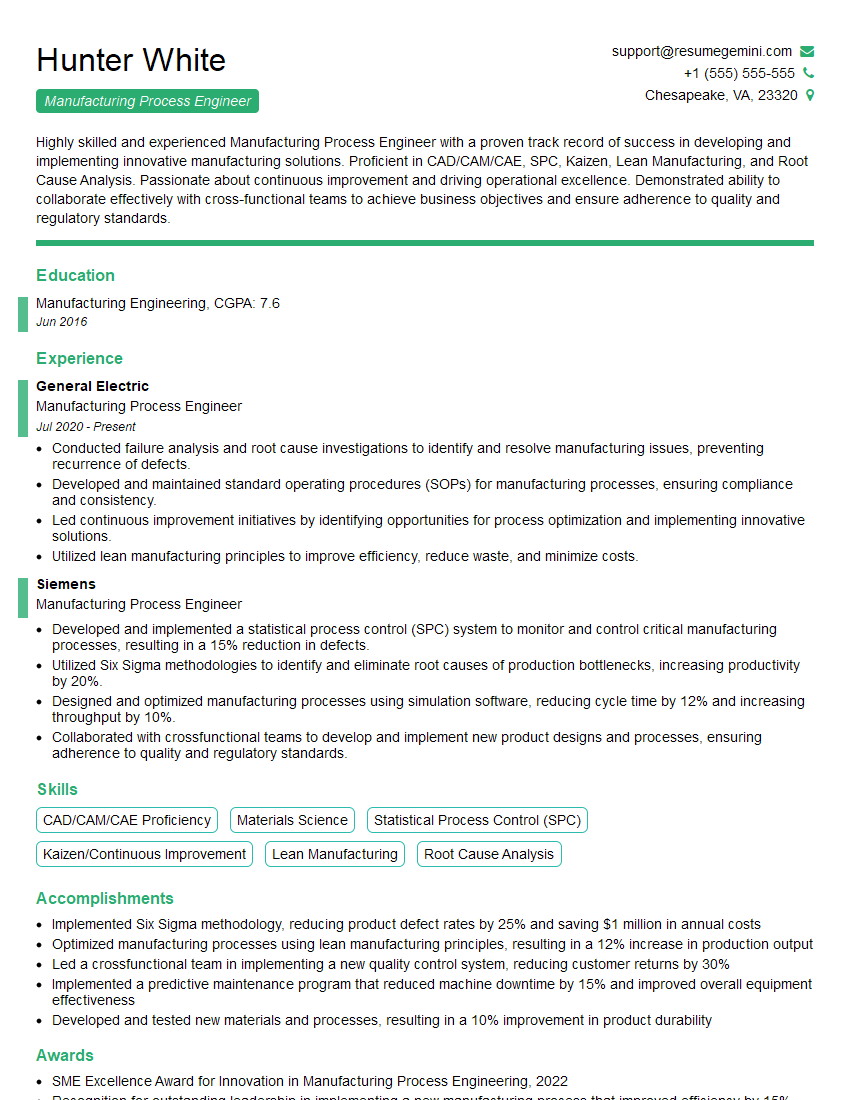
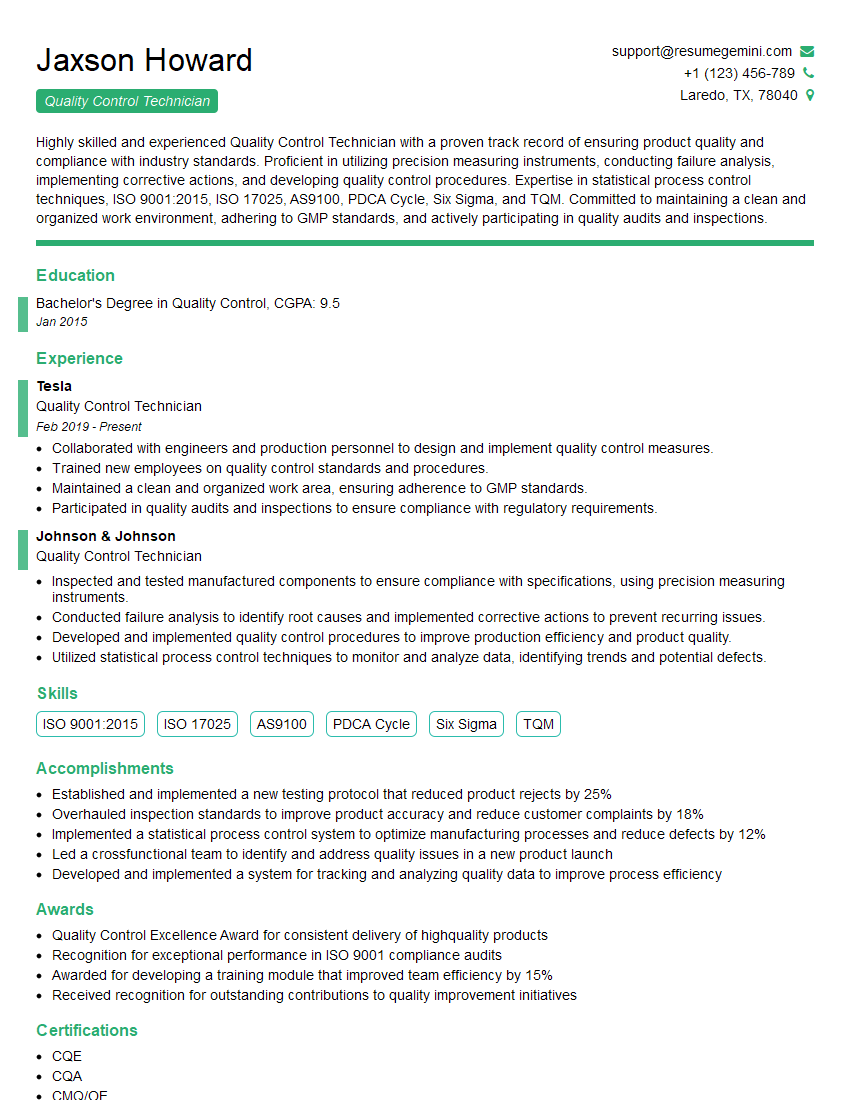
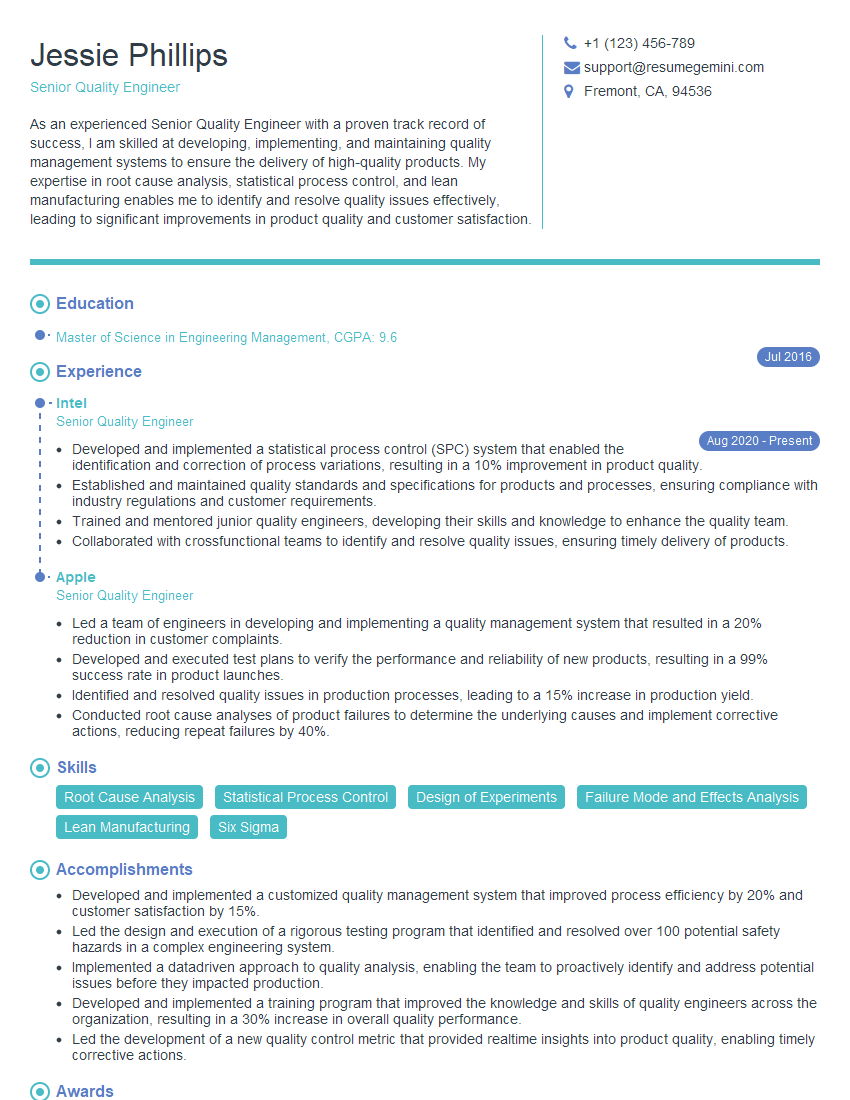
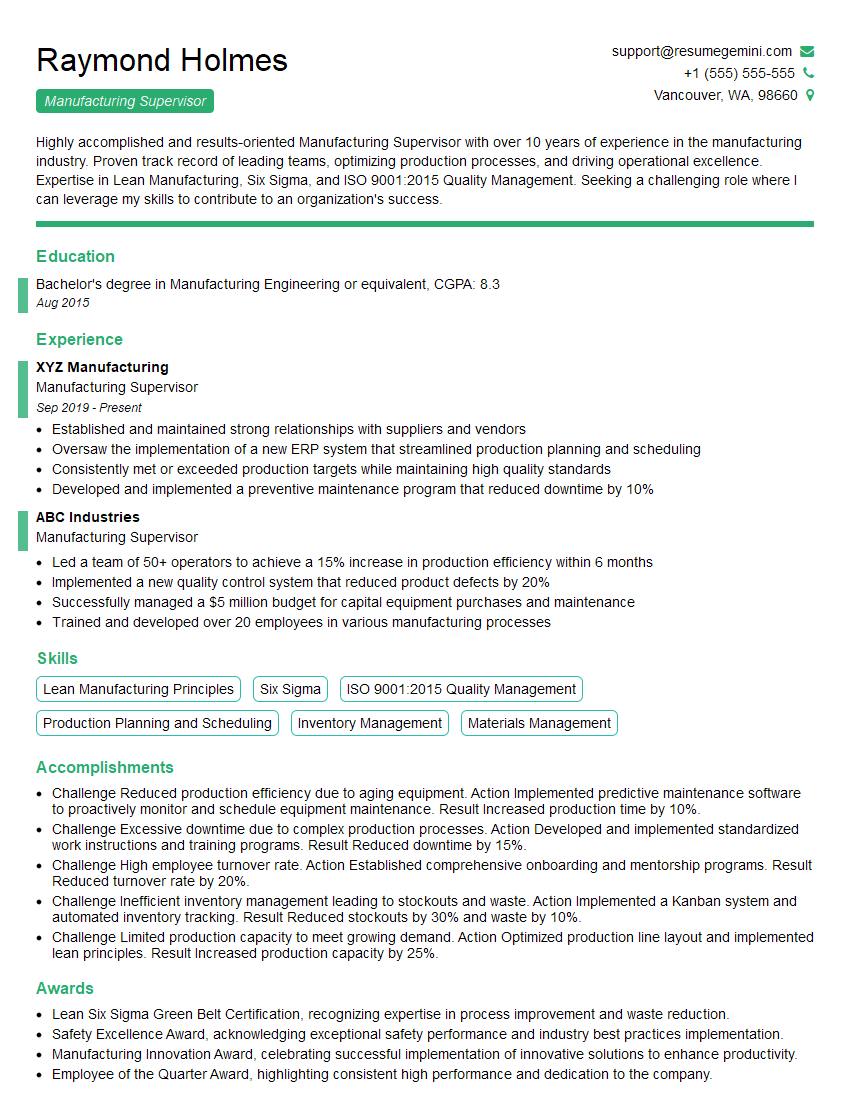
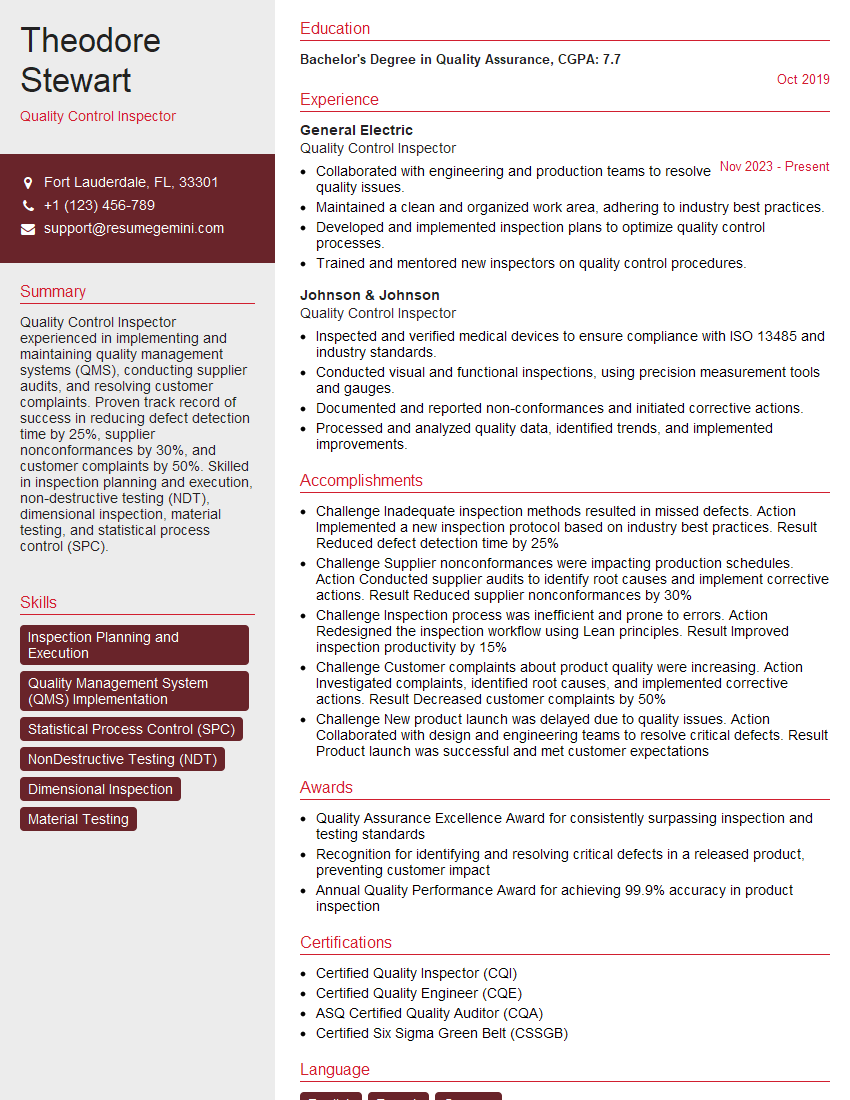
Mastering Statistical Process Control (SPC) for Manufacturing significantly enhances your value in the manufacturing industry, opening doors to advanced roles and higher earning potential. A strong understanding of SPC demonstrates a commitment to quality and process improvement, highly sought-after skills in today’s competitive market. To maximize your job prospects, create an ATS-friendly resume that highlights your SPC expertise. ResumeGemini is a trusted resource to help you build a professional and effective resume that grabs the attention of recruiters. They offer examples of resumes tailored to Statistical Process Control (SPC) for Manufacturing, giving you a head start in presenting your skills and experience compellingly.
Explore more articles
Users Rating of Our Blogs
Share Your Experience
We value your feedback! Please rate our content and share your thoughts (optional).
What Readers Say About Our Blog
Live Rent Free!
https://bit.ly/LiveRentFREE
Interesting Article, I liked the depth of knowledge you’ve shared.
Helpful, thanks for sharing.
Hi, I represent a social media marketing agency and liked your blog
Hi, I represent an SEO company that specialises in getting you AI citations and higher rankings on Google. I’d like to offer you a 100% free SEO audit for your website. Would you be interested?

