Cracking a skill-specific interview, like one for Strong Research and Analysis Skills, requires understanding the nuances of the role. In this blog, we present the questions you’re most likely to encounter, along with insights into how to answer them effectively. Let’s ensure you’re ready to make a strong impression.
Questions Asked in Strong Research and Analysis Skills Interview
Q 1. Describe your experience with qualitative research methods.
Qualitative research explores the ‘why’ behind phenomena, focusing on in-depth understanding rather than numerical data. My experience encompasses various methods, including:
- Semi-structured interviews: I’ve conducted numerous interviews, developing detailed interview guides to explore complex issues. For example, in a study on employee satisfaction, I used open-ended questions to understand the root causes of dissatisfaction beyond simple survey scores.
- Focus groups: I’ve facilitated focus groups to gather diverse perspectives on a specific topic, allowing for rich interaction and the emergence of unexpected insights. In a market research project, focus groups helped identify unmet customer needs regarding a new product design.
- Thematic analysis: I am proficient in systematically identifying, analyzing, and interpreting patterns (themes) within qualitative data. This involved coding transcripts from interviews and focus groups to uncover recurring themes and understand the underlying meanings.
- Ethnographic studies: I have experience in conducting observational studies, immersing myself in the environment to understand the natural behavior and culture of a particular group. A recent project involved observing customer behavior in a retail setting to improve store layout and product placement.
My analysis involves careful transcription, rigorous coding, and detailed interpretation, always ensuring ethical considerations and participant anonymity are prioritized.
Q 2. Explain your experience with quantitative research methods.
Quantitative research uses numerical data and statistical analysis to test hypotheses and establish relationships between variables. My experience includes:
- Survey design and analysis: I’ve designed and administered numerous surveys using various sampling techniques, analyzing the resulting data using statistical software to identify significant trends and correlations. For instance, I designed a large-scale survey to measure the effectiveness of a new educational program, using statistical tests to compare outcomes between control and treatment groups.
- Experimental design: I’m skilled in designing and conducting experiments, controlling variables to isolate cause-and-effect relationships. In one project, I conducted A/B testing on website designs to optimize conversion rates.
- Regression analysis: I’m proficient in using regression models to predict outcomes based on multiple predictor variables. This is frequently used to understand the impact of various factors on a dependent variable (e.g., predicting customer churn based on demographics and usage patterns).
- Causal inference techniques: I understand the importance of establishing causality and employ appropriate techniques like instrumental variables or regression discontinuity designs to mitigate confounding factors.
I always focus on ensuring the validity and reliability of my quantitative studies through appropriate sampling methods, rigorous data cleaning, and the selection of suitable statistical techniques.
Q 3. How do you approach a complex research problem?
Approaching a complex research problem requires a structured and iterative approach. I typically follow these steps:
- Clearly define the problem: Start with a precise statement of the research question, identifying key variables and the desired outcome.
- Literature review: Conduct a thorough review of existing research to understand the current state of knowledge, identify gaps, and refine the research question.
- Methodology selection: Choose appropriate research methods (qualitative, quantitative, or mixed methods) based on the research question and available resources. This might involve considering the feasibility of different approaches.
- Data collection: Implement the chosen methods rigorously, ensuring data quality and ethical considerations. This could involve designing surveys, conducting interviews, or collecting existing datasets.
- Data analysis: Analyze the data using appropriate statistical or qualitative techniques, interpreting the findings in the context of the research question.
- Interpretation and conclusion: Draw conclusions based on the findings, acknowledging limitations and suggesting directions for future research. Consider alternative interpretations and potential biases.
- Dissemination: Communicate the findings clearly and concisely through reports, presentations, or publications.
Throughout the process, flexibility is key. I adapt my approach as needed, based on emerging findings and unforeseen challenges.
Q 4. What statistical software are you proficient in?
I am proficient in several statistical software packages, including:
- R: I utilize R for advanced statistical modeling, data visualization, and creating reproducible research. I’m familiar with various packages such as
ggplot2for visualization anddplyrfor data manipulation. - SPSS: I use SPSS for analyzing large datasets, running statistical tests, and generating reports. It’s particularly helpful for tasks involving descriptive statistics and inferential tests.
- Python (with libraries like Pandas, NumPy, and Scikit-learn): Python’s flexibility allows for data cleaning, preprocessing, and implementing machine learning algorithms. This is valuable for tasks such as predictive modeling and data mining.
My proficiency in these tools allows me to choose the most appropriate software for each project, maximizing efficiency and ensuring accurate results.
Q 5. How do you ensure the accuracy and reliability of your research findings?
Ensuring accuracy and reliability requires attention to detail at every stage of the research process. Key strategies include:
- Rigorous study design: Employing appropriate sampling methods (e.g., random sampling, stratified sampling) and carefully defining variables minimizes bias and improves generalizability.
- Data validation and cleaning: Thorough data cleaning, including handling missing values, outliers, and inconsistencies, ensures data accuracy. This often involves checking for inconsistencies and errors in data entry.
- Appropriate statistical methods: Selecting and applying appropriate statistical tests ensures the validity of the findings. This includes considering assumptions of the tests and choosing methods appropriate for the type of data.
- Transparency and reproducibility: Documenting the research methods, data, and analysis steps ensures transparency and allows others to replicate the study, verifying the results.
- Peer review: Seeking feedback from colleagues or submitting the research for publication facilitates critical evaluation and improves the quality of the work.
By adhering to these principles, I strive to produce research that is credible, reliable, and contributes meaningfully to the field.
Q 6. Describe your experience with data mining and cleaning.
My experience with data mining and cleaning involves several key steps:
- Data acquisition: This involves identifying and obtaining relevant datasets from various sources, such as databases, APIs, or web scraping. I’m experienced in handling both structured and unstructured data.
- Data cleaning: This critical step involves identifying and handling missing values, outliers, inconsistencies, and errors in the data. Techniques include imputation for missing values, outlier removal or transformation, and data standardization.
- Data transformation: This step might involve converting data into a suitable format for analysis (e.g., changing data types, creating new variables). For example, converting categorical variables into numerical ones for regression analysis.
- Data mining techniques: I am familiar with various data mining techniques, such as clustering, association rule mining, and classification, to extract meaningful patterns and insights from the data.
For example, in a project involving customer transaction data, I used data mining to identify customer segments with similar purchasing behavior, helping to personalize marketing campaigns.
Q 7. How do you handle conflicting data sources?
Handling conflicting data sources requires a systematic approach:
- Identify and assess the sources: Evaluate the credibility, reliability, and potential biases of each data source. Consider the methodology used for data collection, sample size, and potential conflicts of interest.
- Investigate the discrepancies: Carefully examine the differences between the data sources, trying to understand the reasons for the conflict. This may involve looking at data collection methods, sample populations, or definitions of variables.
- Data reconciliation: Attempt to resolve the conflicts by identifying and correcting errors or inconsistencies. This might involve checking for data entry errors, inconsistencies in data definitions, or using data cleaning techniques to address outliers or missing values.
- Sensitivity analysis: If the conflicts cannot be resolved, conduct a sensitivity analysis to assess the impact of the different data sources on the overall findings. This helps to understand the uncertainty associated with the results.
- Transparency and reporting: Clearly document the identified conflicts, the methods used to address them, and the potential impact on the conclusions. This ensures transparency and allows readers to evaluate the robustness of the findings.
Choosing the best approach depends on the nature of the conflict and the research question. Sometimes, triangulation (using multiple data sources to validate findings) is the best strategy; other times, a decision must be made to prioritize certain data sources based on their reliability and validity.
Q 8. How do you present your research findings to a non-technical audience?
Presenting complex research findings to a non-technical audience requires translating technical jargon into plain language and focusing on the ‘so what?’ – the implications of the research. I start by outlining the problem the research addresses in relatable terms, using analogies and real-world examples whenever possible. Then, I present the key findings using visuals like charts and graphs, keeping the design clear and simple. I avoid statistical jargon and instead emphasize the story the data tells, highlighting the most important conclusions and their impact. For example, instead of saying ‘the p-value was less than 0.05,’ I might say ‘our results strongly suggest a relationship between X and Y.’ Finally, I conclude by summarizing the key takeaways and answering any questions the audience may have in a clear and concise manner. I always aim for a narrative that engages the audience and leaves them with a clear understanding of the significance of the research.
For instance, when presenting research on customer churn to a board of directors, I wouldn’t delve into the specifics of logistic regression models. Instead, I would focus on the key driver of churn (e.g., lack of customer support), illustrate it visually using a simple bar chart showing the percentage of customers churning due to this factor, and then propose actionable recommendations based on my findings.
Q 9. Describe a time you had to analyze large datasets.
During a project analyzing the effectiveness of a new marketing campaign, I worked with a dataset containing millions of customer interactions across various channels – email, social media, website visits, etc. The sheer volume of data initially seemed overwhelming. To handle it, I utilized a combination of techniques. First, I leveraged cloud-based data warehousing solutions like Snowflake to store and manage the data efficiently. Next, I employed distributed computing frameworks such as Apache Spark to perform parallel processing and reduce analysis time significantly. I focused on extracting key features relevant to the campaign’s success, such as click-through rates, conversion rates, and customer demographics. I used SQL and Python libraries like Pandas and NumPy to clean, transform, and aggregate the data before visualizing trends and patterns using tools like Tableau. By breaking down the problem into manageable chunks and leveraging the right technologies, I was able to successfully analyze the vast dataset and extract actionable insights that directly impacted campaign optimization.
Q 10. How do you identify biases in data?
Identifying biases in data is crucial for ensuring the validity of research findings. I employ a multi-pronged approach. First, I carefully examine the data collection methods to identify potential sources of bias. For example, a survey that only targets a specific demographic group might introduce sampling bias. Second, I analyze the data itself for patterns suggesting bias. This might involve exploring relationships between variables and checking for outliers that might skew the results. Third, I consider potential biases related to the research question itself, ensuring the phrasing doesn’t lead to biased responses. For example, leading questions in a survey can heavily influence the answers. Fourth, I use statistical methods like regression analysis to control for confounding variables, which are factors that may influence both the independent and dependent variables, leading to spurious correlations. Visualizations like histograms and scatter plots also help identify skewed distributions or unusual patterns that may indicate bias. Finally, acknowledging and documenting limitations related to potential biases is essential for transparent and responsible research.
Q 11. How do you determine the appropriate sample size for a research study?
Determining the appropriate sample size depends on several factors, including the desired level of precision, the variability in the population, and the acceptable margin of error. There’s no one-size-fits-all answer, but statistical power analysis is the most reliable method. This involves specifying the desired power (typically 80% or higher), the significance level (alpha, often 0.05), and an estimate of the population variability. Using these parameters, statistical software or online calculators can determine the required sample size. For example, if I’m studying customer satisfaction, I need to consider the variability in satisfaction scores across the customer base. A highly variable population will require a larger sample size to achieve the same level of precision as a less variable population. Additionally, the type of study (e.g., descriptive, correlational, experimental) will also influence the sample size calculation. Larger sample sizes generally lead to more precise estimates but come with increased costs and time investment, so finding the right balance is key.
Q 12. Explain your experience with hypothesis testing.
Hypothesis testing is a cornerstone of statistical inference. It involves formulating a testable hypothesis (e.g., ‘Customer satisfaction is higher among users of product A than product B’), collecting data, and using statistical tests to determine whether the data supports or refutes the hypothesis. I’ve extensively used both parametric tests (like t-tests and ANOVA) for data that meets certain assumptions, and non-parametric tests (like Mann-Whitney U test and Kruskal-Wallis test) for data that doesn’t. The choice of test depends on the data type (continuous, categorical) and the research question. The results of the test provide a p-value, which indicates the probability of observing the obtained results if the null hypothesis (the hypothesis we aim to disprove) were true. A low p-value (typically below a predetermined significance level, like 0.05) suggests that the null hypothesis should be rejected in favor of the alternative hypothesis. It’s crucial to understand that failing to reject the null hypothesis doesn’t necessarily prove it’s true; it simply means there’s not enough evidence to reject it. In my work, hypothesis testing has been vital for validating claims, making informed decisions, and avoiding relying on mere speculation.
Q 13. Describe your experience with regression analysis.
Regression analysis is a powerful tool for modeling the relationship between a dependent variable and one or more independent variables. I have extensive experience with both linear and multiple regression. Linear regression analyzes the relationship between a single independent variable and a dependent variable, while multiple regression extends this to analyze the relationship between multiple independent variables and a dependent variable. For instance, I used multiple regression to model customer spending based on factors like age, income, and marketing campaign exposure. The regression model produces coefficients that quantify the impact of each independent variable on the dependent variable. Furthermore, I use diagnostics to assess the model’s goodness of fit (e.g., R-squared) and the significance of individual predictors. Important considerations include ensuring the assumptions of regression are met (linearity, independence of errors, homoscedasticity, normality of errors), handling multicollinearity (high correlation between independent variables), and interpreting the results carefully to avoid misinterpretations. Regression analysis is essential for understanding complex relationships and making predictions.
Q 14. What are some common pitfalls to avoid in research?
Several pitfalls can undermine the rigor and validity of research. One common issue is confirmation bias, where researchers unconsciously favor evidence supporting their pre-existing beliefs. To mitigate this, I always strive for objectivity and consider alternative explanations for my findings. Another pitfall is overfitting, where a model fits the training data too well but performs poorly on new data. Cross-validation techniques help prevent this. Publication bias, where studies with positive results are more likely to be published than those with null results, is a significant concern. To address this, I focus on replicable methodologies and encourage the reporting of null findings. Ignoring confounding variables can lead to spurious correlations. Careful experimental design and statistical control are essential. Finally, poorly defined research questions or inadequate data quality can render the research useless. Thorough planning and meticulous data cleaning are therefore crucial steps in any research project. By actively addressing these potential issues, I ensure the robustness and trustworthiness of my research findings.
Q 15. How do you prioritize competing research objectives?
Prioritizing competing research objectives requires a strategic approach. I typically employ a framework that combines urgency, importance, and potential impact. First, I list all objectives, then I assess each based on its urgency (deadline), importance (alignment with overall goals), and potential impact (expected contribution to knowledge or organizational goals). I use a matrix or a weighted scoring system to visualize this. For instance, a high-urgency, high-importance, high-impact objective gets top priority. Then, I create a phased approach, tackling the highest-priority objectives first, while strategically allocating resources across the others. This allows for flexibility, as I can adjust priorities if unexpected circumstances arise. For example, if a crucial data source becomes unavailable for a high-priority project, I’ll reassess and potentially shift resources to a secondary project.
Imagine you’re a chef with multiple dishes to prepare for a dinner party. Some dishes have quicker preparations (urgency), some are the main courses (importance), and some might be signature dishes with higher potential to impress (impact). You’d prioritize the most critical dishes first, while managing the preparation of other dishes concurrently.
Career Expert Tips:
- Ace those interviews! Prepare effectively by reviewing the Top 50 Most Common Interview Questions on ResumeGemini.
- Navigate your job search with confidence! Explore a wide range of Career Tips on ResumeGemini. Learn about common challenges and recommendations to overcome them.
- Craft the perfect resume! Master the Art of Resume Writing with ResumeGemini’s guide. Showcase your unique qualifications and achievements effectively.
- Don’t miss out on holiday savings! Build your dream resume with ResumeGemini’s ATS optimized templates.
Q 16. How do you manage time effectively when working on multiple research projects?
Effective time management when juggling multiple research projects is paramount. My strategy revolves around detailed planning, task breakdown, and consistent monitoring. I start by creating a comprehensive project schedule using tools like Gantt charts or project management software. Each project gets broken down into smaller, manageable tasks with assigned deadlines. I then use time-blocking techniques, allocating specific time slots for each task. Regular review and adjustment are key. Weekly progress meetings with myself or a team help me stay on track and identify potential bottlenecks. Prioritization, as discussed earlier, plays a vital role here as well, ensuring that time is spent on the most impactful activities first. The Pomodoro Technique, for instance, helps maintain focus during these blocks. This involved working intensely for 25 minutes, followed by a 5-minute break, to boost productivity and prevent burnout.
Think of it like conducting an orchestra; you have many instruments (projects) playing simultaneously. A well-defined score (plan) with specific timings (schedule) for each instrument is crucial to create a harmonious performance (successful research).
Q 17. Describe your experience using specific research methodologies (e.g., experimental design, case studies).
My experience spans several research methodologies. I’ve extensively used experimental design in studies investigating the effects of social media on consumer behavior. This involved designing controlled experiments with treatment and control groups, carefully manipulating variables, and rigorously analyzing the results using statistical methods like ANOVA and regression analysis. I also have significant experience with case studies, particularly when exploring unique events or phenomena. For example, a case study I conducted analyzed the impact of a specific policy change on a particular company. This involved in-depth data collection through interviews, document reviews, and observations, followed by detailed qualitative and quantitative analysis. My data analysis skills incorporate both descriptive and inferential statistics, always ensuring that the chosen methodology aligns with the research question and the nature of the data.
Q 18. How do you stay up-to-date with the latest research methods and technologies?
Staying current with research methods and technologies is essential. I actively engage in several strategies to achieve this. Firstly, I subscribe to leading academic journals in my field and regularly review relevant publications. Secondly, I participate in conferences and workshops, attending presentations and networking with other researchers. This often provides early access to new methods and techniques. Thirdly, I utilize online resources such as research databases (like Web of Science and Scopus), preprint servers (like arXiv), and MOOCs that offer specialized training in advanced analytical techniques. Finally, I actively follow prominent researchers and institutions on social media platforms, allowing for quick access to the latest developments and breakthroughs.
Think of it like a doctor staying up-to-date with medical advancements; continuous learning is critical for providing the best possible care (research). It’s an ongoing process, not a one-time task.
Q 19. How do you ensure the ethical considerations are addressed in your research?
Ethical considerations are paramount in my research. I adhere to strict guidelines established by my institution’s research ethics board and relevant professional organizations. This involves obtaining informed consent from all participants, ensuring their anonymity and confidentiality, and avoiding any potential harm or bias. Data security is a top priority, employing appropriate measures to protect sensitive information. In research designs, I carefully consider potential ethical implications, adopting strategies to mitigate risks. For instance, if my research involves vulnerable populations, I’d work closely with ethical review boards and community partners to ensure ethical practices throughout the process. Transparency is key; I clearly state any limitations and potential biases in my research publications.
Q 20. Describe your experience with data visualization techniques.
I’m proficient in various data visualization techniques, choosing the best method depending on the data type and the intended message. For example, I use bar charts for comparing categories, line charts for showing trends over time, scatter plots for identifying correlations, and heatmaps for displaying large datasets. I also employ more sophisticated techniques like interactive dashboards and geographic information system (GIS) mapping when appropriate. My visualizations always prioritize clarity, accuracy, and effective communication of findings. I avoid chartjunk and ensure that axes are clearly labeled and titles are descriptive. The goal is always to create visually appealing and easily understandable representations of complex data.
Imagine trying to explain a complex financial report; a well-designed chart can convey information far more effectively than a dense table of numbers.
Q 21. How do you use research findings to make data-driven decisions?
Research findings are fundamental to data-driven decision-making. I translate research insights into actionable strategies by thoroughly analyzing the data, identifying key trends and patterns, and drawing evidence-based conclusions. For example, if research reveals a decline in customer satisfaction, I would analyze the underlying causes and recommend targeted interventions. I then present these findings clearly and concisely, using visualizations and narrative to support my recommendations. This may involve creating reports, presentations, or dashboards to communicate findings to stakeholders. Crucially, I emphasize the limitations of the findings and acknowledge uncertainties, ensuring that decisions are made cautiously, taking into account the context and potential risks.
Think of a ship’s captain using navigation charts and weather reports; data guides the course, but judgment and context are crucial to safe navigation (decision-making).
Q 22. How do you interpret correlation vs. causation?
Correlation and causation are two distinct concepts in research. Correlation simply indicates a relationship between two variables; when one changes, the other tends to change as well. However, correlation does not imply causation. Just because two variables are correlated doesn’t mean one causes the other. There might be a third, unseen variable influencing both, or the relationship could be purely coincidental.
Example: Ice cream sales and drowning incidents are often positively correlated – both increase during summer. However, eating ice cream doesn’t cause drowning. The underlying factor is the warmer weather, which leads to more people swimming and consuming ice cream.
To establish causation, you need to demonstrate a clear mechanism linking the cause to the effect, often through controlled experiments or rigorous observational studies that account for confounding variables. This often involves demonstrating temporal precedence (cause precedes effect), a consistent relationship, and ruling out alternative explanations.
Q 23. Describe a situation where your research impacted business decisions.
In a previous role at a e-commerce company, I conducted research on customer churn. We were experiencing higher-than-expected cancellation rates, impacting revenue significantly. My research involved analyzing customer demographics, purchase history, website interaction data, and customer service interactions. I employed various statistical methods, including survival analysis and logistic regression, to identify key predictors of churn.
My findings revealed that customers who experienced long shipping times, had difficulties navigating the website, or had negative customer service interactions were significantly more likely to churn. This research directly influenced business decisions. Based on my recommendations, the company invested in improving its logistics infrastructure, redesigned its website for better user experience, and implemented a more effective customer service training program. Within six months, we saw a 15% reduction in churn rate, resulting in a substantial increase in customer lifetime value and overall profitability.
Q 24. How do you validate your research findings?
Validating research findings is crucial to ensure the reliability and credibility of your conclusions. I employ a multi-faceted approach that involves:
- Replicating the study: I attempt to reproduce the results using different datasets or methods. Consistency across different analyses strengthens the validity of the findings.
- Peer review: Sharing my research with colleagues and experts in the field allows for critical evaluation and identification of potential biases or flaws.
- Triangulation: Utilizing multiple data sources and methods to confirm the findings. If different approaches lead to similar conclusions, it increases confidence in the results.
- Statistical significance testing: Employing appropriate statistical tests (e.g., t-tests, ANOVA, chi-square tests) to determine the probability that the observed results are due to chance.
- External validation: Testing the findings on a new, independent dataset to ensure generalizability.
It’s important to remember that no single method guarantees perfect validation. A comprehensive approach that combines multiple techniques offers the strongest evidence for the validity of research findings.
Q 25. Explain your understanding of A/B testing.
A/B testing, also known as split testing, is a randomized experiment where two versions of a variable (e.g., a website design, an email subject line, an advertisement) are shown to different segments of users. The goal is to determine which version performs better based on a pre-defined metric (e.g., click-through rate, conversion rate, time spent on page).
How it works: Users are randomly assigned to either group A (control group) or group B (treatment group). The results are then compared to assess statistical significance. If a statistically significant difference is observed, it suggests that one version is superior to the other.
Example: An e-commerce company might A/B test two different versions of its product page: one with a prominent call-to-action button and another with a less prominent one. By tracking conversion rates, they can determine which design leads to more sales.
A/B testing is a powerful tool for making data-driven decisions and optimizing various aspects of a product or service. However, it’s crucial to ensure proper randomization, sufficient sample size, and a well-defined metric to obtain meaningful and reliable results.
Q 26. What is your experience with predictive modeling?
I have extensive experience with predictive modeling, utilizing various techniques to forecast future outcomes based on historical data. My experience includes:
- Regression analysis: Linear regression, logistic regression, polynomial regression, etc., to model the relationship between predictor variables and a target variable.
- Classification algorithms: Decision trees, support vector machines (SVM), naive Bayes, random forests, and neural networks to predict categorical outcomes.
- Time series analysis: ARIMA, exponential smoothing, etc., to forecast time-dependent data.
- Clustering techniques: K-means, hierarchical clustering, etc., to group similar data points together.
Example: In a previous project, I developed a predictive model to forecast customer lifetime value (CLTV) for a telecommunications company. This involved using regression analysis on customer demographics, usage patterns, and churn history. The model accurately predicted CLTV, enabling the company to better target marketing campaigns and allocate resources more effectively.
My experience extends to model selection, evaluation (using metrics like accuracy, precision, recall, AUC), and deployment. I am proficient in using programming languages like Python (with libraries like scikit-learn and TensorFlow) and R for building and deploying predictive models.
Q 27. How comfortable are you working with unstructured data?
I am very comfortable working with unstructured data. This type of data, which lacks a predefined format, presents unique challenges but also offers valuable insights. My approach involves:
- Text mining and natural language processing (NLP): Techniques like tokenization, stemming, lemmatization, and sentiment analysis to extract meaningful information from textual data (e.g., customer reviews, social media posts).
- Image analysis: Utilizing computer vision techniques to extract features from images (e.g., object recognition, image classification).
- Data cleaning and preprocessing: Handling missing values, noise, and inconsistencies in the data before analysis.
- Feature engineering: Creating new features from unstructured data to improve the performance of predictive models.
Example: I once analyzed customer reviews of a product to identify areas for improvement. Using NLP, I extracted keywords and sentiments from the reviews, providing actionable insights for the product development team.
My experience working with unstructured data has significantly enhanced my ability to extract valuable information from a wide range of sources, leading to more comprehensive and insightful analyses.
Q 28. Explain your experience with different types of data analysis (descriptive, diagnostic, predictive, prescriptive).
I have extensive experience with different types of data analysis, each serving a distinct purpose:
- Descriptive analysis: This involves summarizing and describing the main features of a dataset using techniques like measures of central tendency (mean, median, mode), dispersion (variance, standard deviation), and frequency distributions. It provides a high-level overview of the data.
- Diagnostic analysis: This delves deeper into the data to understand the reasons behind the observed patterns. Techniques include drill-down analysis, data mining, and correlation analysis to identify potential causes and relationships.
- Predictive analysis: This focuses on forecasting future outcomes based on historical data using techniques like regression analysis, classification, and time series analysis. The goal is to predict what might happen in the future.
- Prescriptive analysis: This goes beyond prediction by recommending actions to optimize outcomes. It involves using optimization techniques and simulations to determine the best course of action given a set of constraints and objectives.
Example: Imagine analyzing sales data for a retail store. Descriptive analysis might show overall sales figures. Diagnostic analysis might reveal which products are selling well and which are not. Predictive analysis could forecast future sales based on trends, and prescriptive analysis could suggest optimal pricing strategies or inventory management techniques to maximize profits.
My proficiency in all four types of data analysis allows me to provide a comprehensive understanding of data, from basic summaries to actionable recommendations.
Key Topics to Learn for Strong Research and Analysis Skills Interview
- Data Collection & Evaluation: Understanding different research methodologies (qualitative, quantitative), identifying reliable sources, and critically assessing data for bias and validity. Practical application: Discuss how you’ve evaluated conflicting data sets to reach a sound conclusion in a past project.
- Data Analysis Techniques: Proficiency in statistical analysis (e.g., regression, hypothesis testing), data visualization, and interpreting findings. Practical application: Describe your experience using specific analytical tools and techniques to draw meaningful insights from complex data.
- Problem Definition & Hypothesis Formulation: Clearly defining research questions, formulating testable hypotheses, and designing appropriate research strategies. Practical application: Explain how you’ve translated a vague business problem into a clearly defined research question with measurable objectives.
- Report Writing & Communication: Effectively communicating research findings through clear, concise, and visually appealing reports and presentations. Practical application: Detail your experience presenting complex analytical findings to both technical and non-technical audiences.
- Critical Thinking & Problem-Solving: Applying logical reasoning, identifying assumptions, and evaluating potential limitations of research. Practical application: Describe a situation where your critical thinking skills helped you identify a flaw in existing research or analysis.
Next Steps
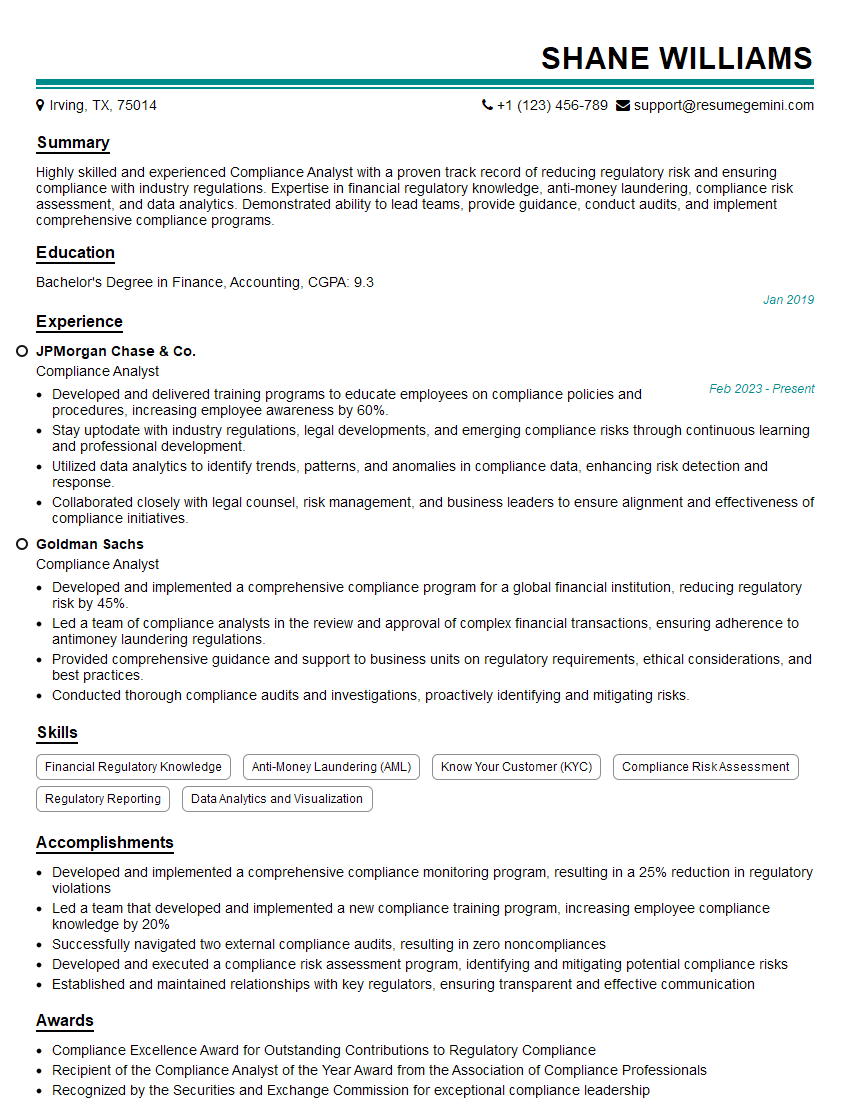
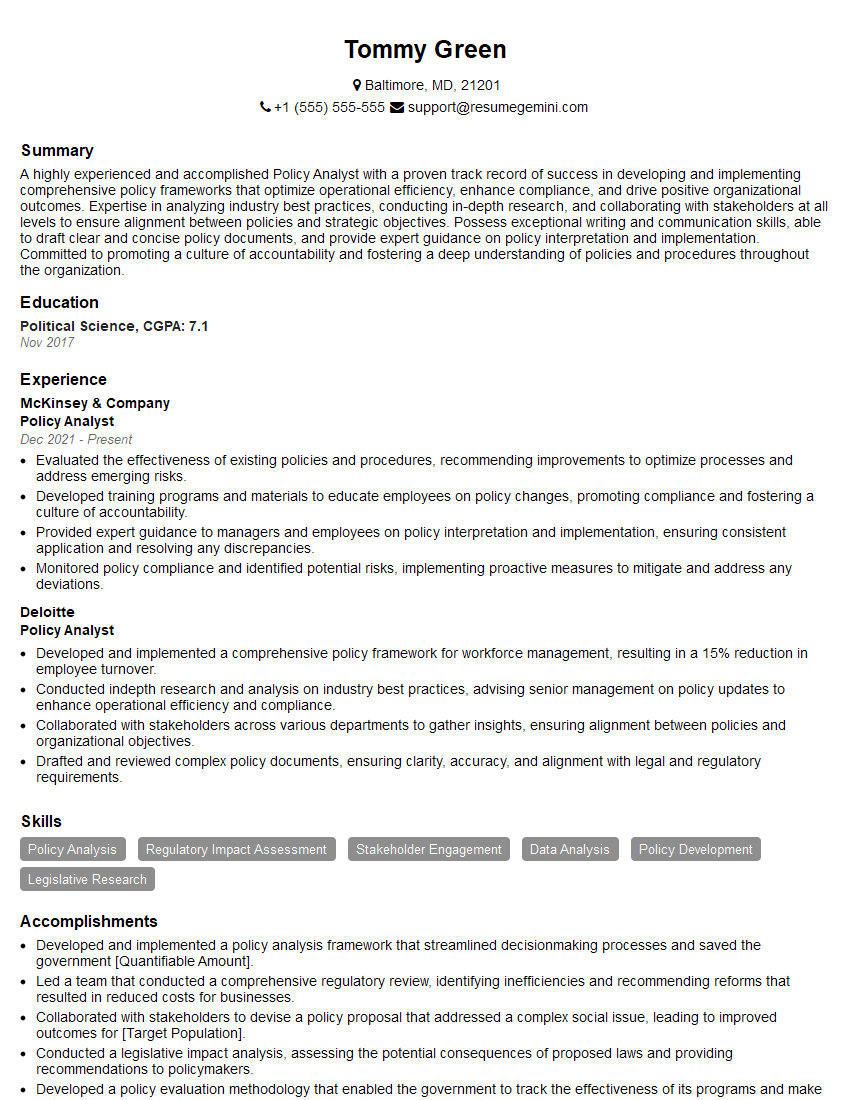
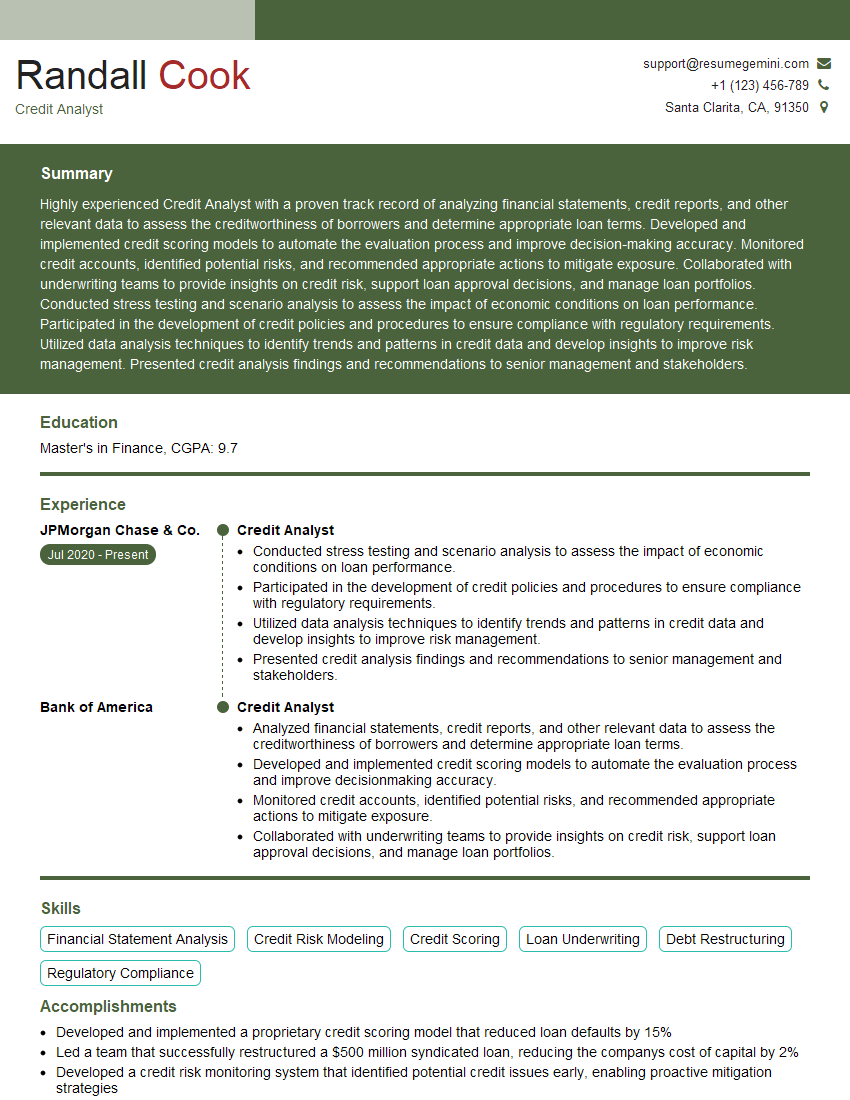
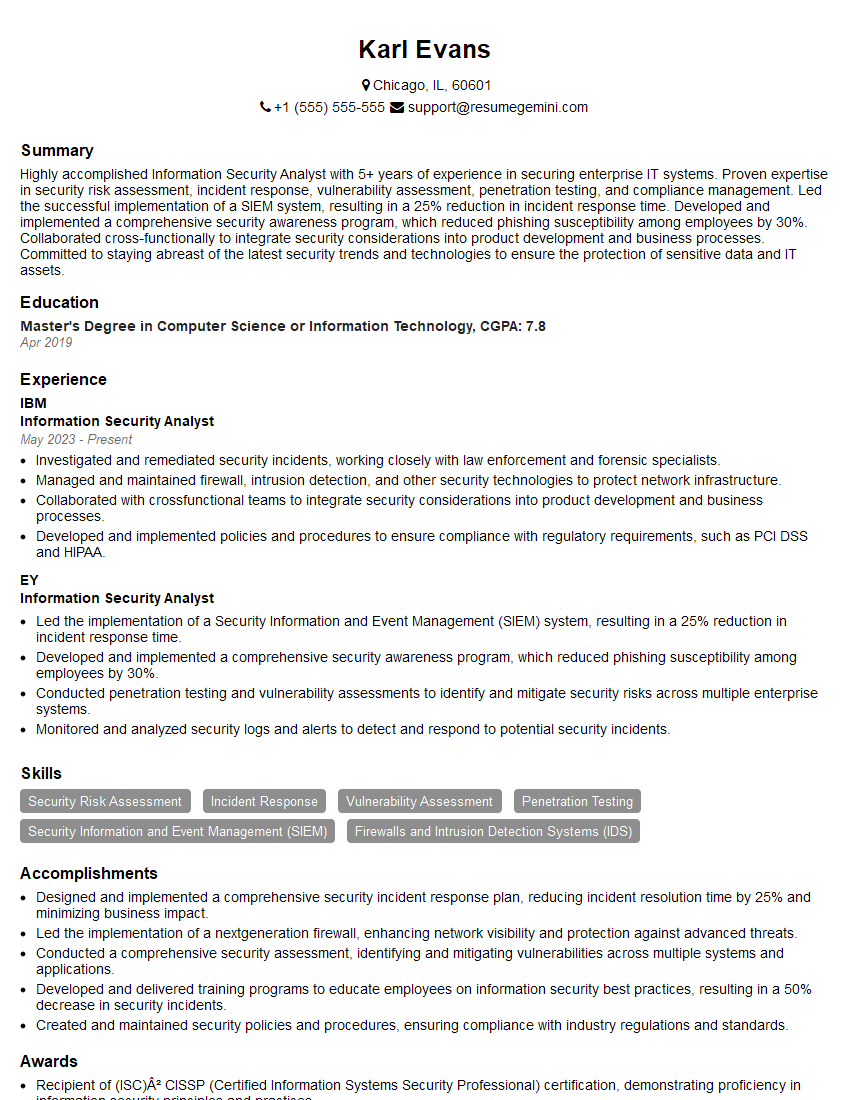
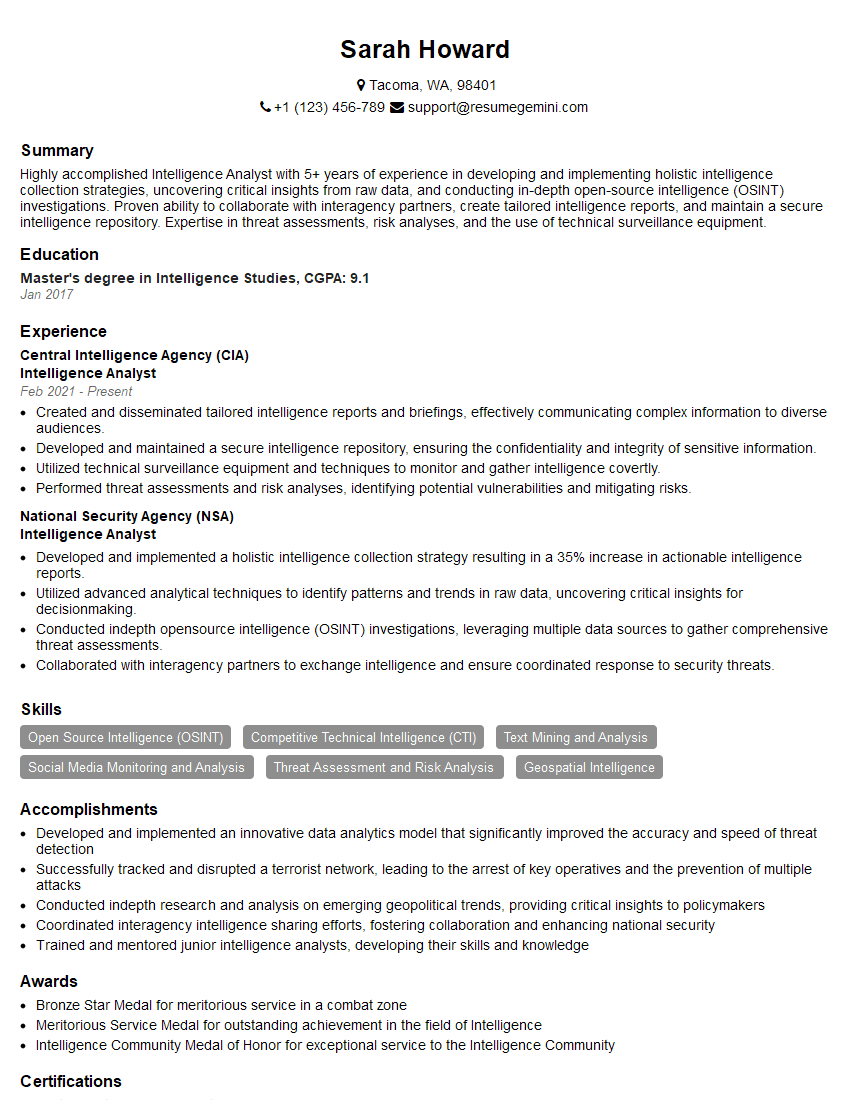
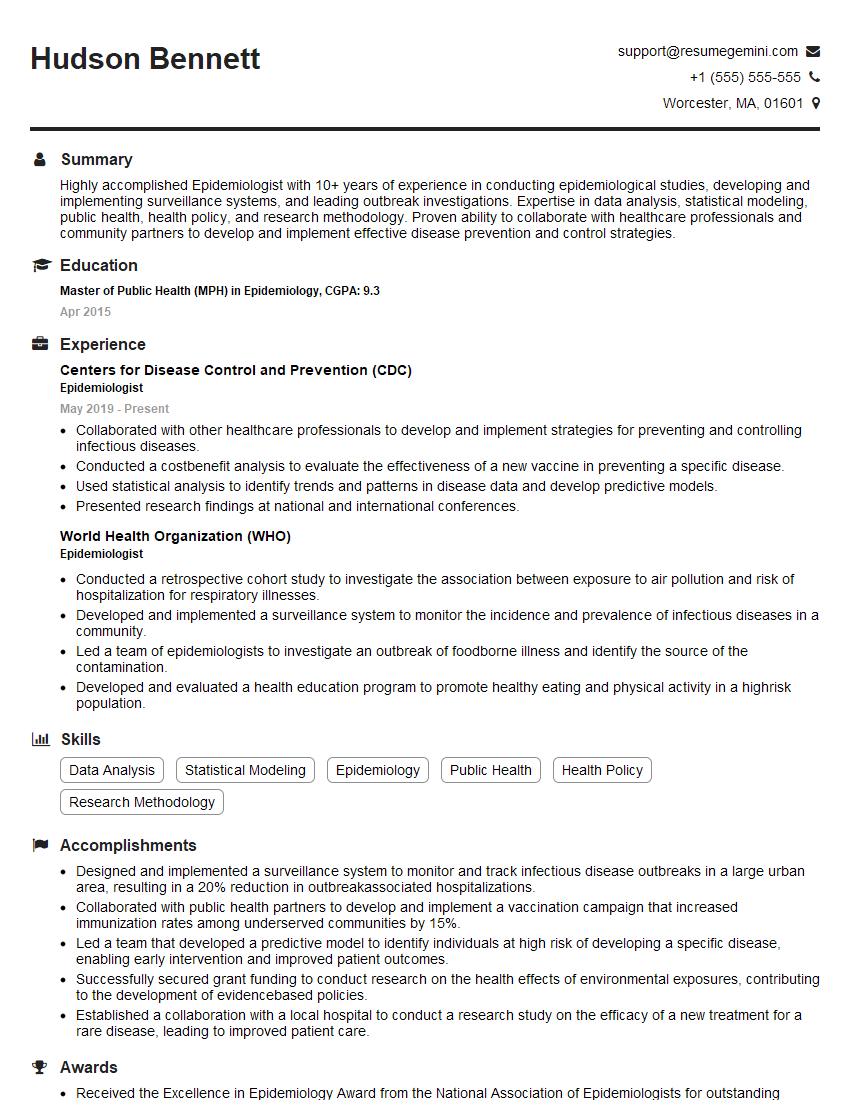
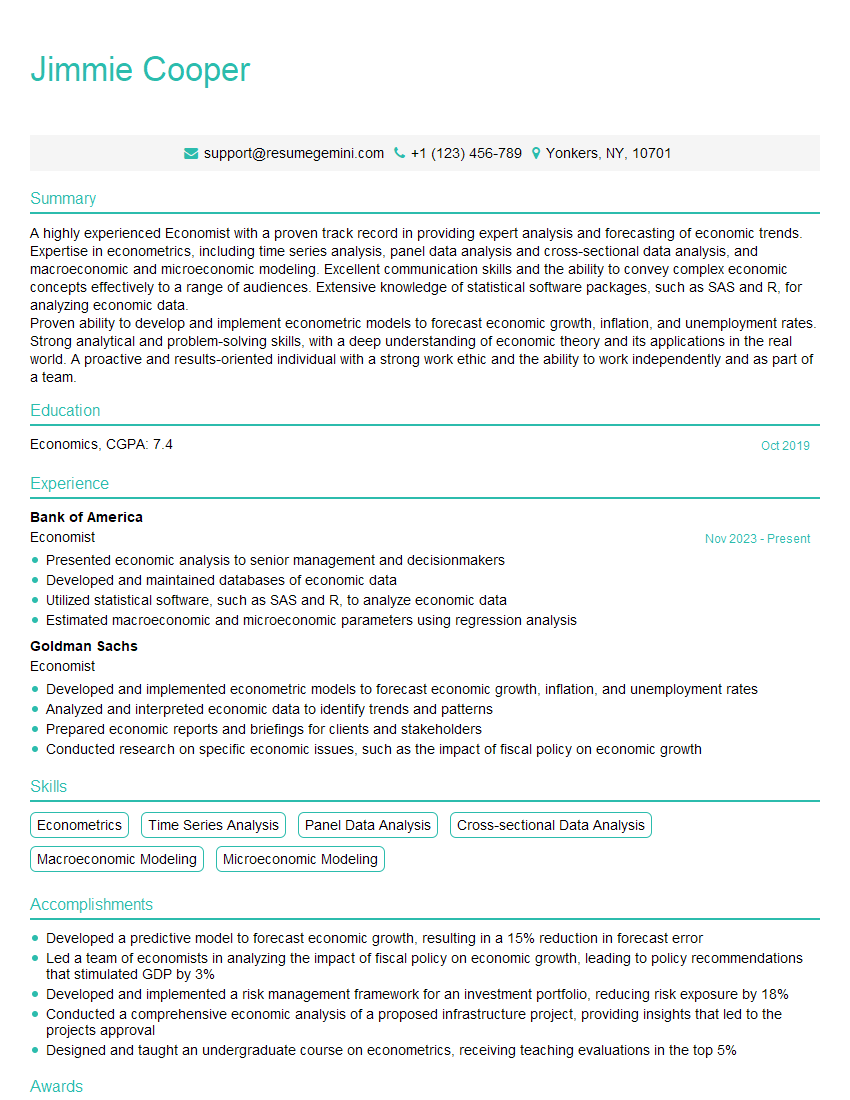
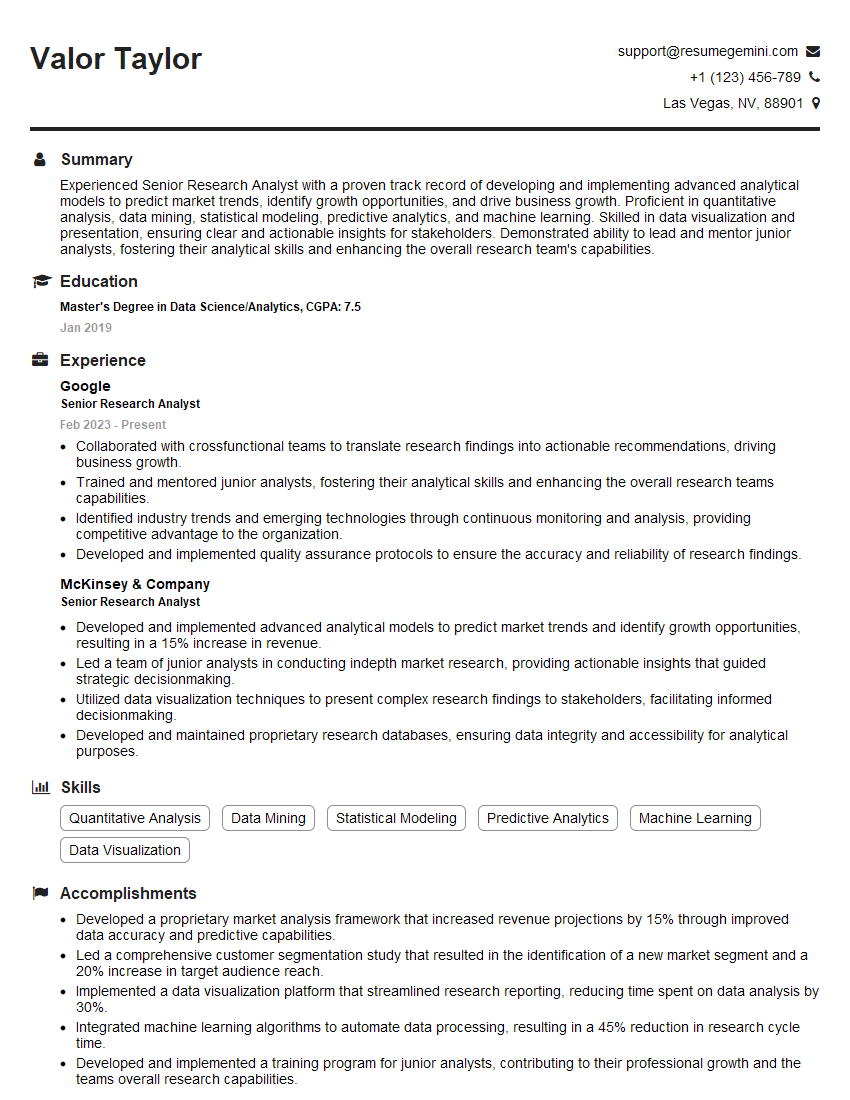
Mastering strong research and analysis skills is paramount for career advancement in today’s data-driven world. These skills are highly sought after across various industries, opening doors to exciting opportunities and increased earning potential. To significantly boost your job prospects, crafting an ATS-friendly resume is crucial. This ensures your application gets noticed by recruiters and hiring managers. We highly recommend using ResumeGemini to build a professional and impactful resume tailored to highlight your research and analysis expertise. ResumeGemini provides examples of resumes specifically designed to showcase strong research and analysis skills, guiding you towards creating a winning application.
Explore more articles
Users Rating of Our Blogs
Share Your Experience
We value your feedback! Please rate our content and share your thoughts (optional).
What Readers Say About Our Blog
Interesting Article, I liked the depth of knowledge you’ve shared.
Helpful, thanks for sharing.
Hi, I represent a social media marketing agency and liked your blog
Hi, I represent an SEO company that specialises in getting you AI citations and higher rankings on Google. I’d like to offer you a 100% free SEO audit for your website. Would you be interested?

