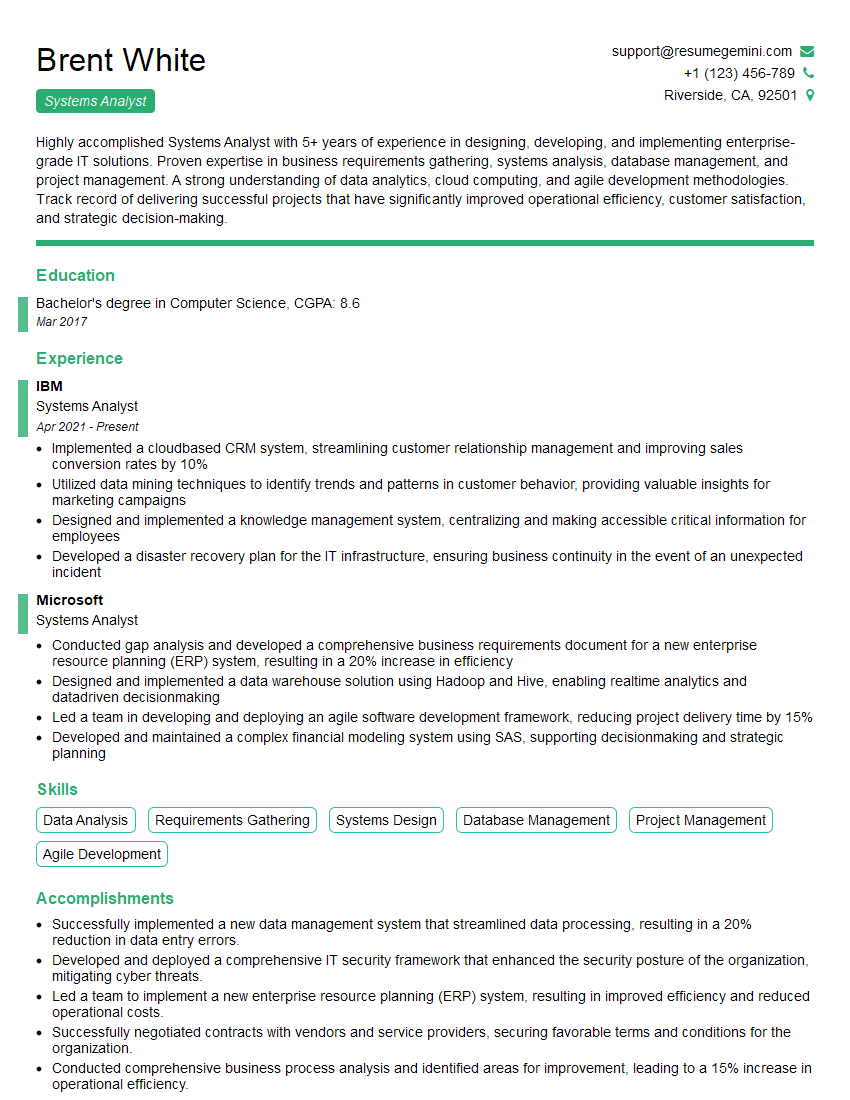
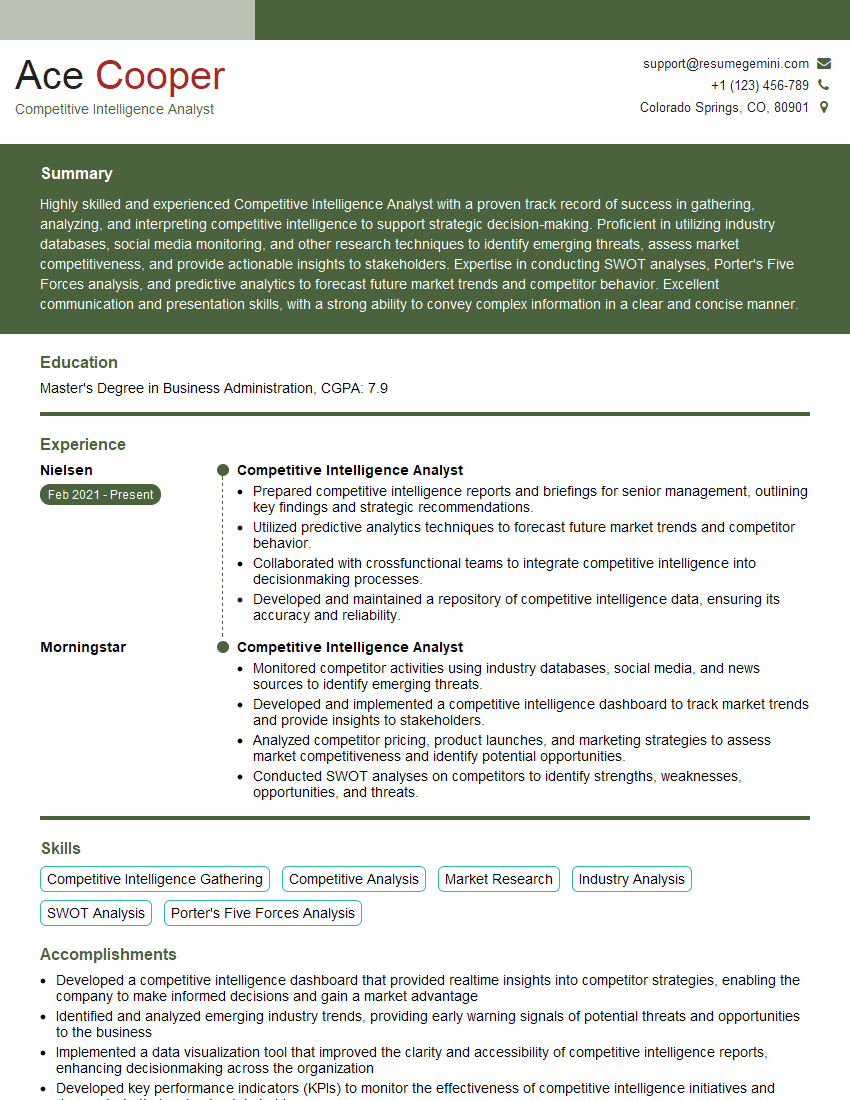
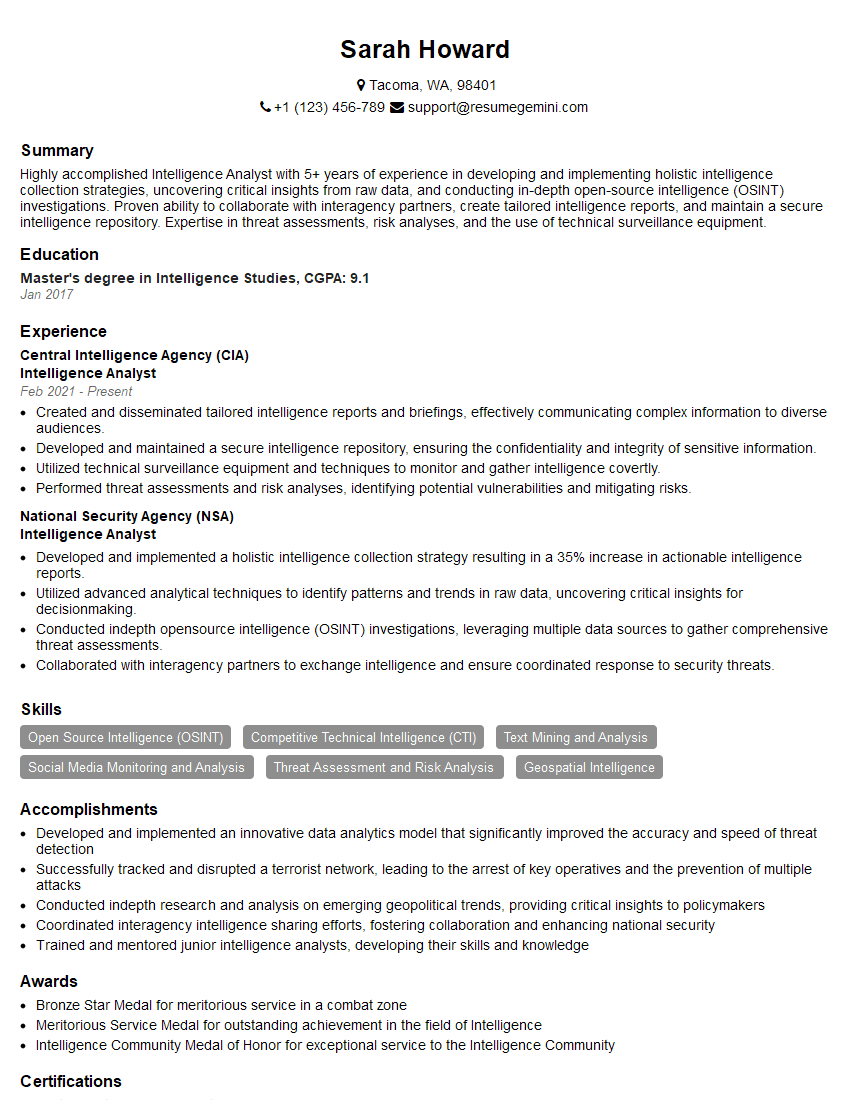
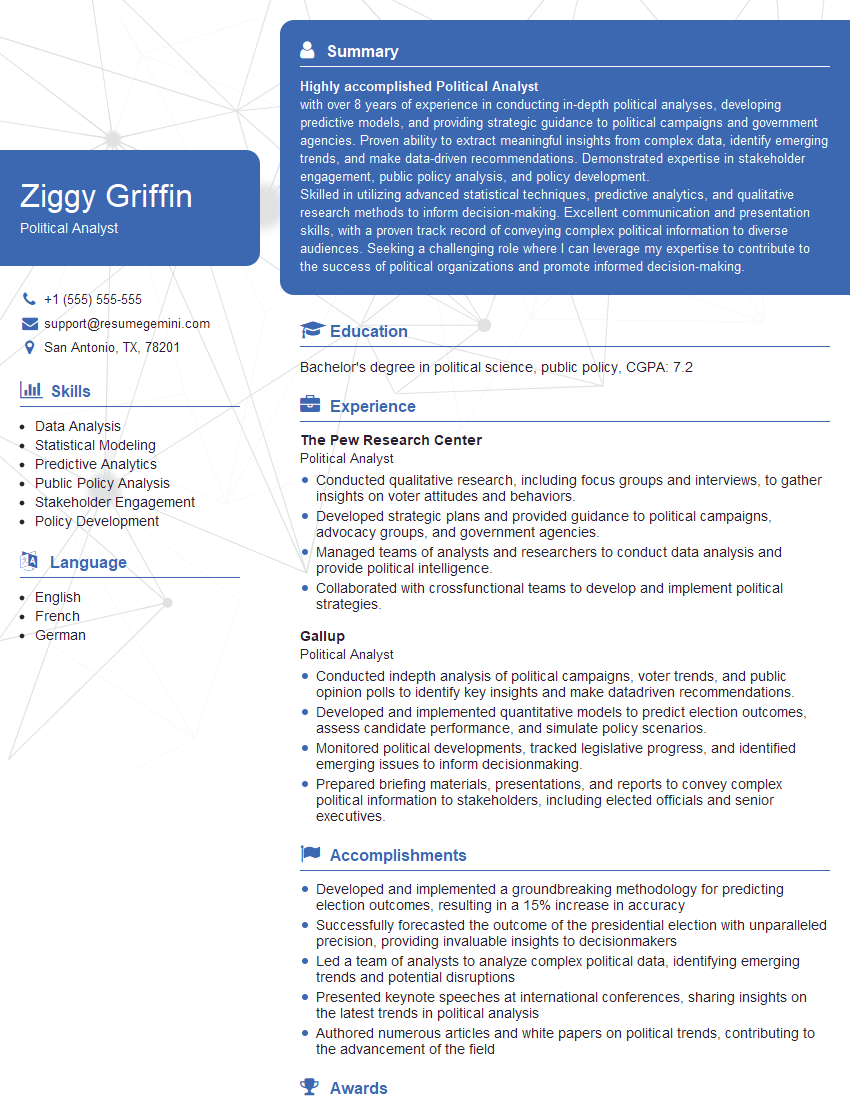
Interviews are opportunities to demonstrate your expertise, and this guide is here to help you shine. Explore the essential tactical analysis and reporting interview questions that employers frequently ask, paired with strategies for crafting responses that set you apart from the competition.
Questions Asked in tactical analysis and reporting Interview
Q 1. Describe your experience in conducting SWOT analyses.
A SWOT analysis is a fundamental strategic planning technique used to identify Strengths, Weaknesses, Opportunities, and Threats related to a business, project, or competitive landscape. My experience involves conducting these analyses across various contexts, from evaluating market entry strategies for new products to assessing the operational efficiency of existing processes.
My process typically involves:
- Defining the scope: Clearly outlining the specific area or project the SWOT analysis will focus on.
- Gathering information: Employing brainstorming sessions, surveys, interviews, competitive research, and data analysis to collect relevant information.
- Identifying Strengths and Weaknesses (internal factors): These are aspects within the control of the organization. For example, a strength could be a strong brand reputation, while a weakness might be outdated technology.
- Identifying Opportunities and Threats (external factors): These are aspects outside of the organization’s control. An opportunity might be a growing market demand, whereas a threat could be increased competition.
- Prioritizing factors: Determining the most critical strengths, weaknesses, opportunities, and threats based on their potential impact.
- Developing actionable strategies: Creating strategies that leverage strengths, mitigate weaknesses, capitalize on opportunities, and address threats.
For example, in a recent analysis for a client launching a new SaaS product, we identified a strong development team as a strength, high initial investment costs as a weakness, increasing cloud adoption as an opportunity, and the presence of established competitors as a threat. This informed the marketing and pricing strategies we recommended.
Q 2. Explain your process for identifying key performance indicators (KPIs).
Identifying Key Performance Indicators (KPIs) is crucial for measuring progress towards strategic goals. My approach focuses on aligning KPIs directly with business objectives and ensuring they are measurable, achievable, relevant, and time-bound (SMART).
My process typically involves:
- Defining objectives: Clearly articulating the overall strategic goals the KPIs will measure. What are we trying to achieve?
- Identifying key areas: Determining the critical areas of the business that need monitoring (e.g., sales, marketing, customer service, operations).
- Selecting relevant KPIs: Choosing specific metrics that directly reflect performance in those key areas. Examples include conversion rates, customer churn, average order value, and employee satisfaction.
- Establishing baselines: Gathering historical data or conducting research to establish a benchmark for performance.
- Setting targets: Defining realistic and challenging targets for each KPI based on the baseline and strategic objectives.
- Regular monitoring and reporting: Implementing a system for tracking and reporting on KPI performance to ensure accountability and allow for timely adjustments.
For instance, if the objective is to increase market share, relevant KPIs could include website traffic, lead generation, and sales conversion rates. By monitoring these KPIs, we can track progress and make data-driven decisions to achieve the objective.
Q 3. How do you prioritize competing demands and conflicting information in your analysis?
Prioritizing competing demands and conflicting information requires a structured approach. I use a combination of methods to ensure the most critical aspects are addressed effectively.
My process usually involves:
- Data Triangulation: Verifying information from multiple sources to identify inconsistencies and biases. If different data sources provide conflicting information, I investigate further to understand the reasons for discrepancies.
- Impact Assessment: Evaluating the potential impact of each piece of information or demand on the overall goals. This helps to prioritize issues that have the most significant consequences.
- Risk Analysis: Assessing the potential risks associated with ignoring or delaying specific demands or information. This helps to highlight critical issues that require immediate attention.
- Prioritization Matrix: Using a matrix (e.g., Eisenhower Matrix – Urgent/Important) to categorize demands and information based on urgency and importance. This allows for effective time management and resource allocation.
- Stakeholder Input: Consulting with key stakeholders to gain their perspectives and incorporate their priorities into the decision-making process.
Imagine a scenario where marketing wants immediate campaign adjustments while the sales team reports critical customer issues. A risk assessment would indicate customer issues require immediate attention due to potential financial implications, while the marketing campaign adjustments can be postponed for a more informed decision based on the customer resolution.
Q 4. What methods do you use to gather and verify data for your reports?
Data gathering and verification are fundamental to accurate and reliable reporting. My approach involves a multi-faceted strategy to ensure data integrity.
Methods I utilize:
- Primary Data Collection: Conducting surveys, interviews, focus groups, and observations to collect firsthand information. This allows for direct interaction with data sources.
- Secondary Data Collection: Using publicly available data, industry reports, internal databases, and other reliable sources to supplement primary data. This broadens the scope of the analysis.
- Data Cleaning and Validation: Checking for inconsistencies, outliers, and errors in the data. This involves using statistical methods to identify and address potential issues.
- Source Verification: Evaluating the credibility and reliability of all data sources. This includes assessing the reputation, methodology, and potential biases of the source.
- Data Transformation and Aggregation: Converting data into a usable format and consolidating information from multiple sources. This often requires using specific software and techniques.
For example, when analyzing customer satisfaction, I might use customer surveys (primary data) and website analytics (secondary data), cross-referencing them to identify potential areas for improvement and verify the accuracy of the findings.
Q 5. How do you ensure the accuracy and reliability of your data sources?
Ensuring the accuracy and reliability of data sources is paramount. My approach focuses on a rigorous evaluation process and the implementation of robust quality control measures.
My strategies include:
- Source Credibility Assessment: Evaluating the reputation, expertise, and potential biases of the data source. This often involves researching the source’s history and methodology.
- Data Validation Techniques: Employing statistical methods to identify outliers and inconsistencies within the data itself. This helps ensure that the data is representative of the true picture.
- Cross-Referencing Data: Comparing data from multiple sources to identify discrepancies and ensure consistency. This can highlight errors or biases in individual sources.
- Data Provenance Tracking: Maintaining a clear record of the origin and transformation of the data. This helps to ensure transparency and accountability throughout the analysis process.
- Regular Audits: Periodically reviewing data sources and data collection methods to ensure continued accuracy and reliability.
For instance, if using government statistics, I’ll verify the methodology employed and the data’s timeframe to ensure relevance and accuracy. Similarly, internal data will be cross-checked against sales figures and other relevant metrics for consistency.
Q 6. Describe your experience with different data visualization techniques.
Data visualization is critical for conveying insights effectively. My experience encompasses a wide range of techniques, selected based on the type of data and target audience.
Techniques I use:
- Bar charts and column charts: For comparing categories or showing changes over time. Useful for highlighting key differences or trends.
- Line charts: For showing trends and patterns over time. Effective for illustrating gradual changes or growth.
- Pie charts: For showing the proportion of different categories within a whole. Suitable for demonstrating relative sizes or market share.
- Scatter plots: For showing the relationship between two variables. Useful for identifying correlations or patterns.
- Heatmaps: For visualizing data in a matrix format, highlighting areas of high or low concentration. Excellent for illustrating relationships between many variables.
- Geographic maps: For showing data across geographical locations. Useful for illustrating regional variations or distribution patterns.
- Dashboards: For combining multiple visualizations into a single, interactive interface. Ideal for providing a comprehensive overview of key performance indicators.
The choice of visualization is crucial; a bar chart would be suitable for presenting sales figures across different product lines, while a heatmap would be more appropriate to show customer churn rates across different demographic groups.
Q 7. How do you present complex information clearly and concisely to a non-technical audience?
Presenting complex information clearly to a non-technical audience requires a simplified and engaging approach. My strategy focuses on translating technical jargon into plain language and employing visual aids to enhance understanding.
My techniques include:
- Using plain language: Avoiding technical jargon and using simple, straightforward language that everyone can understand.
- Focusing on the story: Framing the data within a narrative that is engaging and relatable. This helps to make the information more memorable.
- Employing visual aids: Using charts, graphs, and other visual tools to illustrate key findings. This makes the information more accessible and easier to digest.
- Highlighting key takeaways: Summarizing the most important findings in a clear and concise manner. This ensures that the audience grasps the core message.
- Using analogies and metaphors: Relating complex concepts to familiar situations or objects. This helps to make abstract ideas more concrete and relatable.
- Interactive presentations: Engaging the audience through questions and discussions to ensure understanding.
For example, instead of saying “The coefficient of determination (R-squared) indicates a strong positive correlation,” I might say “Our analysis shows a strong relationship between marketing spend and sales: when we spend more on marketing, sales generally increase significantly.” This makes the information immediately understandable without technical expertise.
Q 8. Explain your experience with different data analysis software (e.g., SQL, Tableau, Python).
My experience with data analysis software spans several platforms, each offering unique strengths for different tasks. I’m highly proficient in SQL, using it extensively for data extraction, transformation, and loading (ETL) processes. For instance, I’ve used SQL to efficiently query large datasets of player tracking data to isolate key performance indicators (KPIs) like pass completion percentages within specific zones on the field. I then leverage Tableau for dynamic visualization and reporting, creating dashboards that present complex tactical insights in a clear and accessible manner. Imagine a dashboard showing heatmaps of player movements, overlaid with pass success rates – this helps coaches instantly identify areas for improvement. Finally, Python, with libraries like Pandas and Scikit-learn, forms the core of my predictive modeling work. I’ve built models to forecast player performance based on historical data, allowing for more data-driven decision-making.
Q 9. How do you handle situations where data is incomplete or unreliable?
Incomplete or unreliable data is a common challenge in tactical analysis. My approach is multifaceted. First, I thoroughly investigate the source of the data to understand the reasons for incompleteness or unreliability. Is it due to missing sensors, human error in data entry, or inherent limitations in data collection methods? Once identified, I determine the extent of the issue. If the missing data is minimal and random, imputation techniques (like filling missing values with the mean or median) might be suitable. However, for larger gaps or systematic errors, more sophisticated approaches like multiple imputation or model-based techniques may be necessary. For instance, if tracking data is missing for a specific player during a certain period, I might use their historical average movement speed and positioning to estimate the missing data, always making it clear in the report that this is an estimate.
Rigorous quality checks are critical. I validate data against other sources when possible and flag any significant inconsistencies. Transparency is key; my reports always clearly state any assumptions made or limitations due to data quality issues.
Q 10. Describe your experience in developing predictive models.
Developing predictive models is a crucial aspect of my work. I primarily use Python and its machine learning libraries. For example, I developed a model that predicts the probability of a successful shot based on factors like shooting distance, angle, player fatigue (measured through tracking data), and the defender’s positioning. This model helps coaches identify optimal shooting opportunities and understand why shots are successful or unsuccessful. Another project involved predicting player injuries using various physiological and performance metrics gathered over time. The models I build are never black boxes. I always strive for explainability, using techniques like feature importance analysis to understand the driving factors behind the predictions. The models’ accuracy is rigorously tested through techniques like cross-validation, and the performance metrics (like precision, recall, and F1-score) are transparently reported.
Q 11. How do you identify and mitigate potential biases in your analysis?
Bias mitigation is paramount. I actively look for potential biases in data collection, analysis, and interpretation. For example, confirmation bias can creep in if we only look for data that confirms pre-existing beliefs. To counter this, I use a structured approach: carefully defining the scope of the analysis, establishing clear research questions, and selecting appropriate statistical methods. I also pay close attention to the data collection process. Are there any sampling biases? Are there groups underrepresented in the data? This might influence the conclusions, and I make sure to flag these concerns. Furthermore, I ensure that my models are evaluated rigorously and that metrics are chosen appropriately to prevent bias creeping into model selection and interpretation. I regularly employ blind testing methodologies to minimize confirmation bias in results interpretations.
Q 12. How do you ensure the timely delivery of your reports?
Timely delivery is achieved through meticulous planning and efficient workflow management. I start by clearly defining the scope and timeline of the project with stakeholders. This includes identifying potential bottlenecks and allocating sufficient time for each stage. I use project management tools to track progress, prioritize tasks, and identify any delays promptly. Automation plays a crucial role. I automate repetitive tasks using scripting languages like Python to streamline processes and free up time for more complex analysis. Finally, regular communication with stakeholders is essential to ensure that everyone is on the same page and that any adjustments to the timeline can be made proactively.
Q 13. Describe your experience with root cause analysis.
Root cause analysis is essential for understanding the underlying reasons behind performance issues or unexpected events. I typically use the 5 Whys technique – repeatedly asking ‘why’ to drill down to the root cause. For example, if a team’s passing accuracy is low, I might ask: ‘Why is the passing accuracy low?’ (Answer: poor decision-making under pressure). ‘Why is there poor decision-making under pressure?’ (Answer: lack of training in high-pressure scenarios). This method provides a systematic approach to identify the root cause and prevent recurrence. More complex situations might warrant other techniques like the Fishbone diagram or Fault Tree Analysis. The key is to avoid jumping to conclusions and systematically eliminate potential causes until the root cause is identified.
Q 14. What is your approach to identifying trends and patterns in data?
Identifying trends and patterns involves a combination of statistical techniques and visual exploration. I start by visually exploring the data using graphs and charts in Tableau to get an initial understanding of the data distribution. Then, I employ statistical methods such as correlation analysis to identify relationships between variables. Time-series analysis is used to identify trends over time. For example, I might analyze a team’s passing accuracy over the course of a season, identify any periods of consistent improvement or decline, and correlate it with coaching changes, player injuries, or other factors. Clustering techniques can reveal groups of players with similar characteristics or performance patterns. The combination of visual exploration and quantitative analysis provides a robust approach to uncover hidden patterns in the data.
Q 15. Explain your understanding of statistical significance.
Statistical significance, in the context of tactical analysis, refers to the probability that an observed effect or relationship in data did not occur by random chance. It’s crucial for determining whether a pattern we see is genuinely meaningful or just a fluke. We typically assess significance using p-values. A p-value below a pre-defined threshold (often 0.05) indicates that the observed result is statistically significant, meaning there’s less than a 5% chance it occurred randomly.
For example, imagine we’re analyzing player performance data and find that players who completed more than 80% of their passes scored significantly more goals (p < 0.01). This low p-value suggests a genuine link between high pass completion rates and goal-scoring success, not just a random coincidence. We wouldn't draw the same conclusion if the p-value were 0.15, as this suggests a higher likelihood that the observed relationship is due to chance.
Understanding statistical significance allows us to confidently identify true trends and patterns in data, avoiding spurious correlations that can lead to flawed strategic decisions. It’s essential to consider the context and limitations of statistical significance, as a statistically significant result doesn’t always imply practical significance or a causal relationship.
Career Expert Tips:
- Ace those interviews! Prepare effectively by reviewing the Top 50 Most Common Interview Questions on ResumeGemini.
- Navigate your job search with confidence! Explore a wide range of Career Tips on ResumeGemini. Learn about common challenges and recommendations to overcome them.
- Craft the perfect resume! Master the Art of Resume Writing with ResumeGemini’s guide. Showcase your unique qualifications and achievements effectively.
- Don’t miss out on holiday savings! Build your dream resume with ResumeGemini’s ATS optimized templates.
Q 16. How do you use data to support strategic decision-making?
Data is the cornerstone of effective strategic decision-making in tactical analysis. I leverage data to identify trends, predict outcomes, and evaluate the effectiveness of strategies. This involves a multi-step process:
- Data Collection and Cleaning: First, I gather relevant data from various sources, such as match tracking, scouting reports, and player statistics. Thorough cleaning and validation are vital to ensure data accuracy and reliability.
- Exploratory Data Analysis (EDA): I use EDA techniques like visualization and summary statistics to explore the data, identify patterns, and formulate hypotheses.
- Statistical Modeling: Depending on the research question, I employ various statistical models like regression analysis, time series analysis, or clustering to analyze the data and test hypotheses.
- Scenario Planning: I use the findings from the analyses to create multiple potential scenarios, considering various factors and their potential impact.
- Recommendation and Implementation: Finally, I communicate my findings and recommendations clearly to stakeholders, suggesting actionable strategies based on data-driven insights.
For instance, if analyzing opponent team data reveals a weakness in their left flank defense, I can recommend adjusting our attacking strategy to exploit that vulnerability, potentially leading to more goals and a higher probability of victory.
Q 17. Describe your experience in creating dashboards and reports.
I have extensive experience creating interactive dashboards and reports using tools such as Tableau and Power BI. My dashboards are designed to be visually appealing and user-friendly, providing stakeholders with a clear and concise overview of key performance indicators (KPIs). Reports are typically more in-depth, providing a detailed analysis of specific aspects of performance.
For example, a typical dashboard might display real-time match statistics (possession, shots on target, etc.), while a report might delve into a detailed analysis of a player’s performance over a specific period, identifying strengths and areas for improvement. My dashboards and reports are tailored to the specific needs and preferences of the stakeholders, ensuring the information is easily accessible and understandable.
I ensure the reports are well-structured, using clear headings, concise language, and effective visualizations. Data is presented accurately and ethically, avoiding misinterpretations or misleading conclusions. I always include clear explanations of the methodology and limitations of the analysis.
Q 18. How do you communicate your findings to stakeholders?
Communicating findings effectively is crucial. I tailor my communication style to the audience. With technical stakeholders, I can use more statistical jargon and detailed explanations. With less technical stakeholders, I prioritize clear, concise language, visuals, and storytelling.
My communication methods include:
- Presentations: I deliver clear and engaging presentations summarizing key findings and recommendations.
- Written Reports: I create comprehensive written reports providing a detailed analysis and supporting evidence.
- Interactive Dashboards: I use interactive dashboards to allow stakeholders to explore the data themselves.
- One-on-One Meetings: I conduct individual meetings to address specific questions or concerns.
I always encourage questions and discussions to ensure everyone understands the findings and their implications. I focus on translating complex data into actionable insights that are easily understood and applied.
Q 19. Explain your experience in collaborating with cross-functional teams.
Collaboration is essential in tactical analysis. I’ve worked extensively with cross-functional teams, including coaches, scouts, medical staff, and data scientists. Effective collaboration requires clear communication, mutual respect, and a shared understanding of goals.
In one project, I worked with scouts to integrate their qualitative observations with quantitative data to create a more comprehensive player profile. This involved translating scouting reports into a structured data format and integrating it with performance metrics. The combined data provided a much richer understanding of player capabilities and potential, leading to better recruitment decisions.
I actively participate in team discussions, contribute my expertise, and actively listen to other team members’ perspectives. I utilize collaboration tools like shared workspaces and project management software to streamline communication and workflow.
Q 20. Describe a time you had to adapt your analysis to changing circumstances.
During a playoff series, our initial analysis indicated a strong correlation between opponent turnovers and our scoring opportunities. However, the opponent unexpectedly shifted their strategy in game three, drastically reducing turnovers. Our initial analysis was becoming less relevant.
I adapted by quickly incorporating new data points and re-analyzing the data, focusing on alternative indicators of opponent vulnerability. We shifted our focus to identifying weaknesses in their defensive positioning and pressing strategy. This quick adaptation allowed us to adjust our tactical approach and maintain a competitive edge, ultimately leading to success in the series. This experience reinforced the importance of continuous monitoring and adaptation in the face of changing circumstances and unexpected opponent adjustments.
Q 21. How do you ensure the security and confidentiality of sensitive data?
Data security and confidentiality are paramount. I adhere to strict protocols to protect sensitive information. This includes:
- Access Control: Implementing robust access control measures to restrict access to sensitive data based on the principle of least privilege.
- Data Encryption: Encrypting data both in transit and at rest to protect against unauthorized access.
- Regular Audits: Conducting regular security audits and vulnerability assessments to identify and mitigate potential risks.
- Data Anonymization: Anonymizing or pseudonymizing data where possible to protect individual privacy.
- Compliance with Regulations: Adhering to relevant data privacy regulations (e.g., GDPR, CCPA).
I also undergo regular training to stay informed about the latest security best practices and threats. Maintaining data integrity and confidentiality is not only ethically crucial but also essential for maintaining trust and credibility.
Q 22. What is your experience with A/B testing and its applications?
A/B testing, also known as split testing, is a randomized experiment where two or more versions of a variable (e.g., a website headline, an email subject line, or a product image) are shown to different segments of users to determine which performs better. It’s a cornerstone of data-driven decision-making. My experience spans various applications, from optimizing marketing campaigns to improving user interface design.
For instance, in a recent project, we A/B tested two different landing page designs for a client’s e-commerce website. One version featured prominent product images and concise copy, while the other focused on customer testimonials and a more detailed product description. By tracking key metrics like conversion rates and time spent on the page, we determined that the version with prominent product images outperformed the other, resulting in a significant increase in sales.
Another example involved testing different email subject lines to improve open rates. We used a statistical significance test to ensure the observed differences weren’t due to chance. This method allows for precise measurement and ensures that any observed improvements are genuinely attributable to the changes made.
Q 23. How do you stay current with advancements in data analysis techniques?
Staying current in the rapidly evolving field of data analysis requires a multifaceted approach. I regularly attend industry conferences and webinars, participate in online courses offered by platforms like Coursera and edX, and actively engage with online communities such as those on Stack Overflow and various data science forums. This exposure keeps me up-to-date on the latest techniques and best practices.
Furthermore, I subscribe to industry-leading publications and journals focusing on data analysis and related fields. I also dedicate time to reading research papers and exploring open-source tools and libraries. This constant learning process is critical to adapting to new methodologies and technologies, maintaining a competitive edge, and delivering the best possible results for my clients.
Q 24. Explain your experience with different types of forecasting methods.
My experience encompasses a wide range of forecasting methods, selecting the most appropriate approach depending on the data available and the specific business problem. I’ve successfully utilized both qualitative and quantitative methods. Quantitative methods include time series analysis (ARIMA, Exponential Smoothing), regression analysis (linear, logistic, multiple), and machine learning algorithms (such as Random Forest or Gradient Boosting) for more complex scenarios.
For example, in one project, we used ARIMA modeling to predict future sales based on historical sales data, seasonality, and trends. In another, we employed a regression model to forecast customer churn based on factors like customer demographics and engagement metrics. The choice of method always depends on data characteristics and the desired level of accuracy. Qualitative methods, such as expert opinions and Delphi techniques, are also incorporated when appropriate to complement quantitative models, particularly when dealing with uncertainties or less structured data.
Q 25. Describe your experience in presenting your findings to senior management.
Presenting findings to senior management requires clear, concise communication tailored to their needs and understanding. I prioritize translating complex data into easily digestible insights, using visuals like charts, graphs, and dashboards to enhance comprehension. I avoid technical jargon and focus on the ‘so what?’ aspect – the implications of the findings for the business and strategic decision-making.
In my experience, structuring presentations around a clear narrative, highlighting key takeaways, and providing actionable recommendations are crucial. I usually start with the executive summary, followed by the methodology, key findings, and then the implications and recommendations. Interactive dashboards and data visualizations are integral parts of my presentations, allowing for dynamic exploration of the results and answering management’s questions effectively. Finally, I always allow time for Q&A to address any concerns or clarifications needed.
Q 26. How do you handle criticism of your analysis?
Criticism of my analysis is viewed as an opportunity for improvement and refinement. I believe in a collaborative approach, actively engaging in a constructive dialogue to understand the concerns raised. I meticulously review the critiques, examining the methodology, data sources, and interpretations to identify any potential flaws or areas needing clarification.
If the criticism highlights a genuine issue, I revise my analysis and documentation accordingly. If the criticism stems from a misunderstanding, I patiently explain the methodology and rationale behind my conclusions. Transparency and a willingness to adapt are essential in such situations. Ultimately, the goal is to ensure the analysis is accurate, robust, and readily understood by all stakeholders.
Q 27. Describe your experience with qualitative data analysis.
Qualitative data analysis involves interpreting non-numerical data like interviews, surveys, and observations to understand themes, patterns, and insights. My experience includes employing various techniques such as thematic analysis, content analysis, and grounded theory. Thematic analysis involves identifying recurring patterns or themes within the data. Content analysis quantifies the presence of specific words or concepts in the text.
For example, in a recent project analyzing customer feedback, we used thematic analysis to identify key themes related to customer satisfaction, leading to actionable improvements in product design and customer service. This process provides deeper understanding of customer perceptions and preferences beyond what numerical data alone can offer. Combining qualitative and quantitative methods often provides a more comprehensive understanding of the issue at hand.
Q 28. How do you measure the impact of your analysis and reporting?
Measuring the impact of my analysis and reporting is critical. I employ various metrics depending on the specific project. Key Performance Indicators (KPIs) are carefully selected and tracked to assess the effectiveness of implemented recommendations. For instance, in marketing campaigns, improved conversion rates or increased customer acquisition are key measures of success. For operational improvements, metrics like reduced costs or increased efficiency are tracked.
Beyond direct KPIs, I also assess the extent to which my analysis has informed strategic decision-making. This often involves qualitative feedback from stakeholders, documenting how my insights influenced their choices and ultimately contributed to organizational goals. This comprehensive approach ensures a holistic understanding of the value delivered through my work, beyond simply the numbers generated.
Key Topics to Learn for Tactical Analysis and Reporting Interviews
- Data Collection & Source Evaluation: Understanding various data sources (e.g., video analysis software, statistical databases, scouting reports) and critically evaluating their reliability and limitations.
- Match Analysis Techniques: Applying frameworks for analyzing match events, including positional play, passing networks, defensive actions, and attacking patterns. Practical application: Analyzing a match to identify key strengths and weaknesses of a team.
- Performance Indicators & Metrics: Selecting and interpreting relevant key performance indicators (KPIs) to quantify player and team performance. Practical application: Developing a dashboard visualizing key metrics for a specific player or team.
- Visualizing Data & Reporting: Effectively communicating analytical findings through clear and concise reports, utilizing charts, graphs, and other visual aids. Practical application: Creating a presentation summarizing your analysis for stakeholders.
- Opponent Analysis & Scouting: Identifying opponent strengths, weaknesses, and typical tactical approaches. Practical application: Preparing a pre-match report highlighting opponent tendencies and potential vulnerabilities.
- Problem-Solving & Decision-Making: Applying analytical findings to inform tactical decisions, suggesting improvements, and proactively identifying potential issues. Practical application: Suggesting tactical adjustments based on your analysis of a recent match.
- Software & Tools Proficiency: Demonstrating familiarity with relevant software and tools used in tactical analysis (e.g., Wyscout, InStat, video editing software).
Next Steps
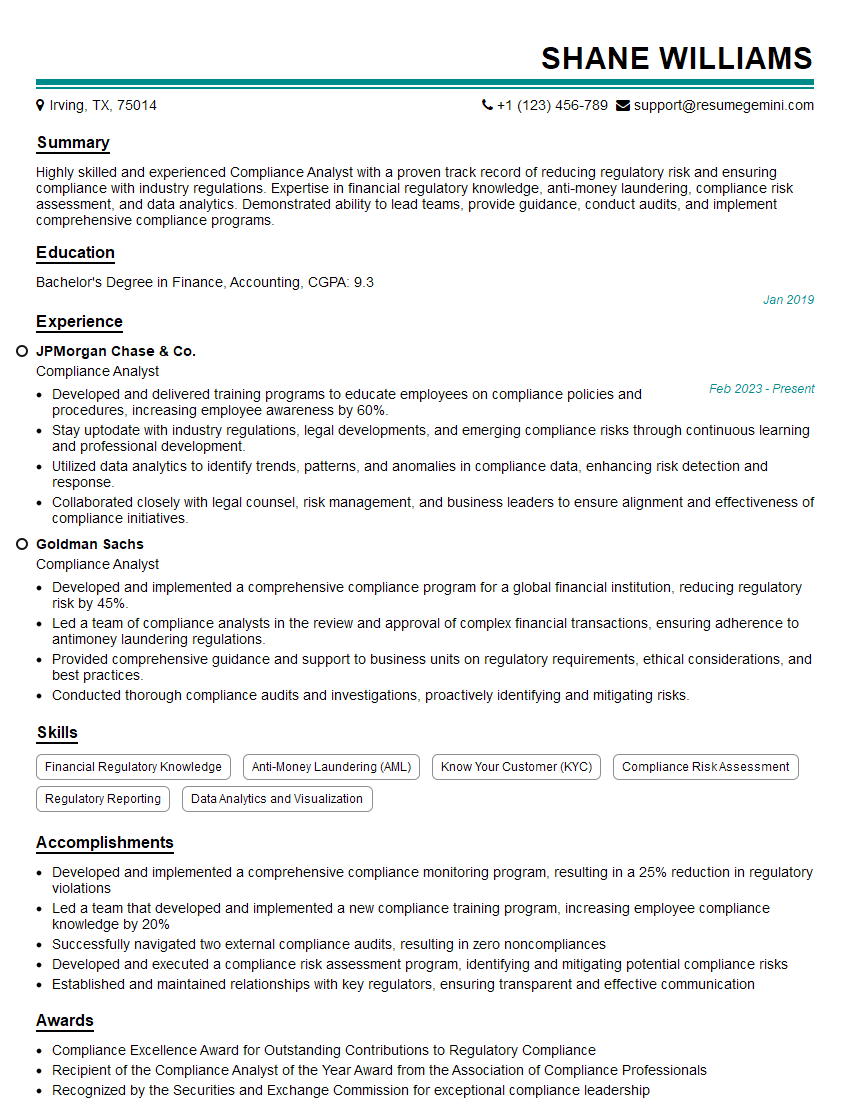
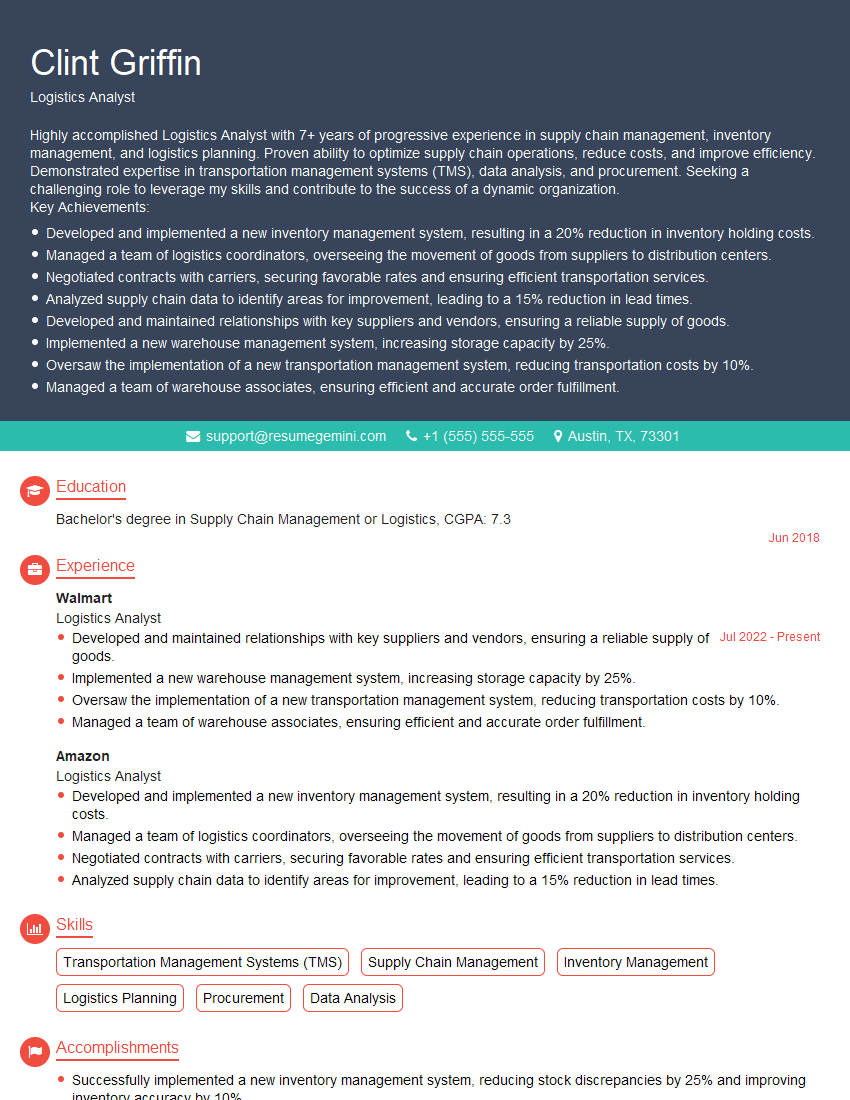
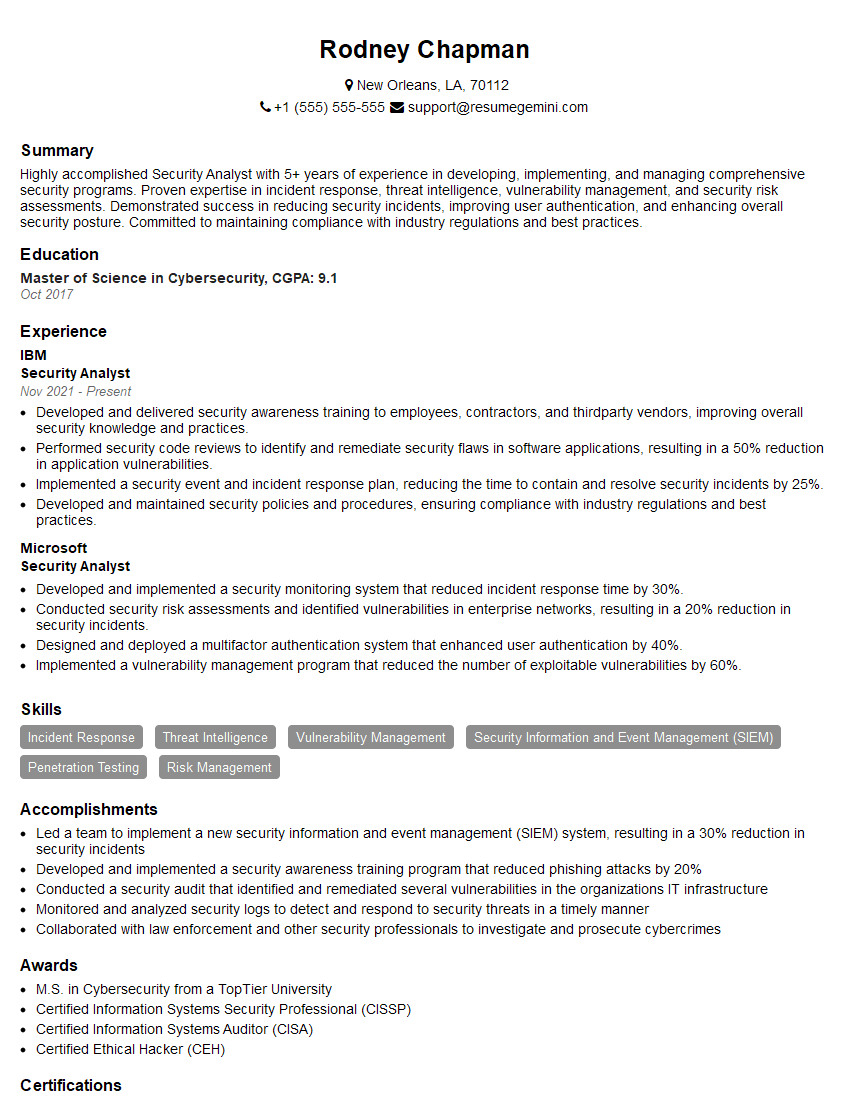
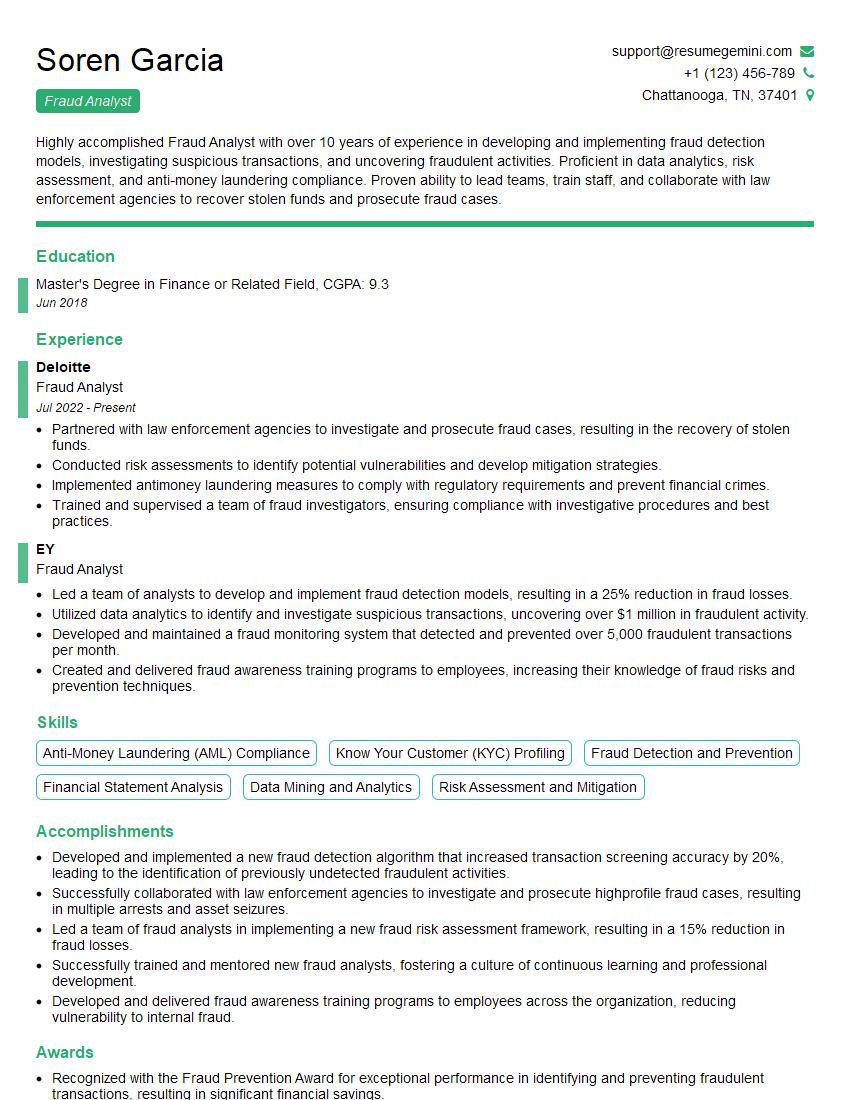
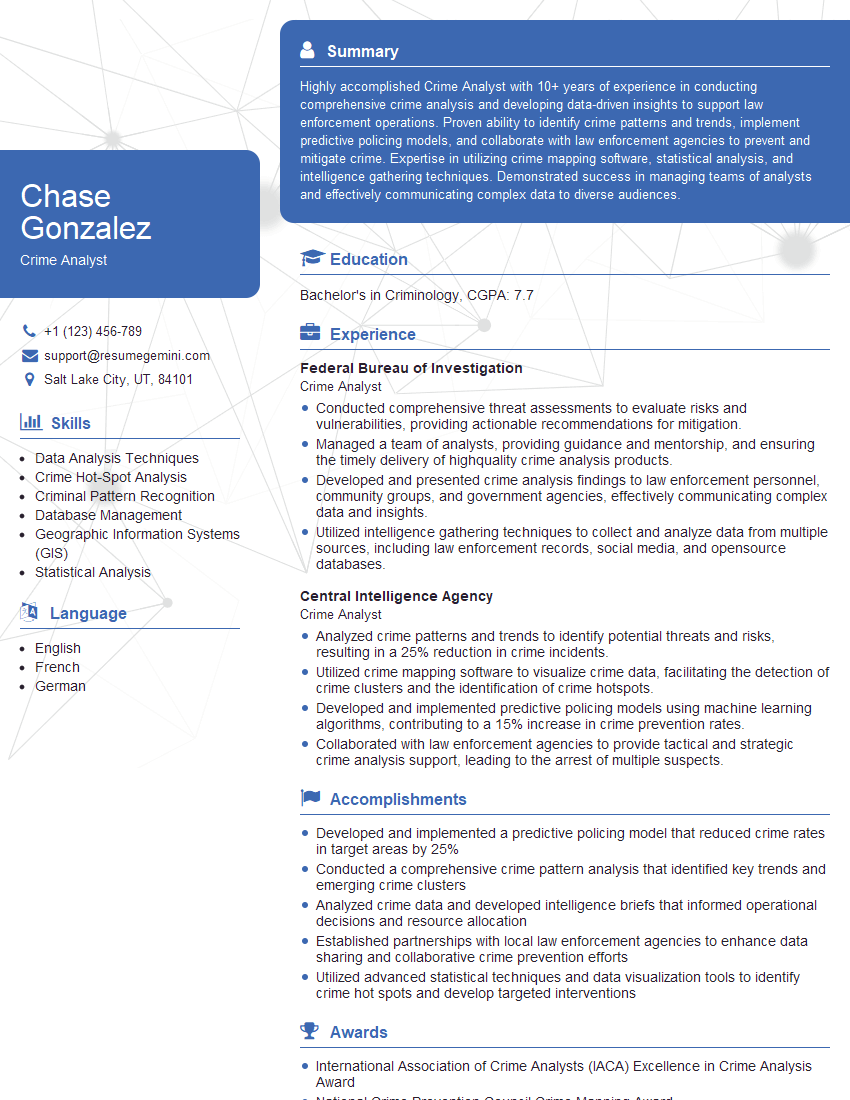
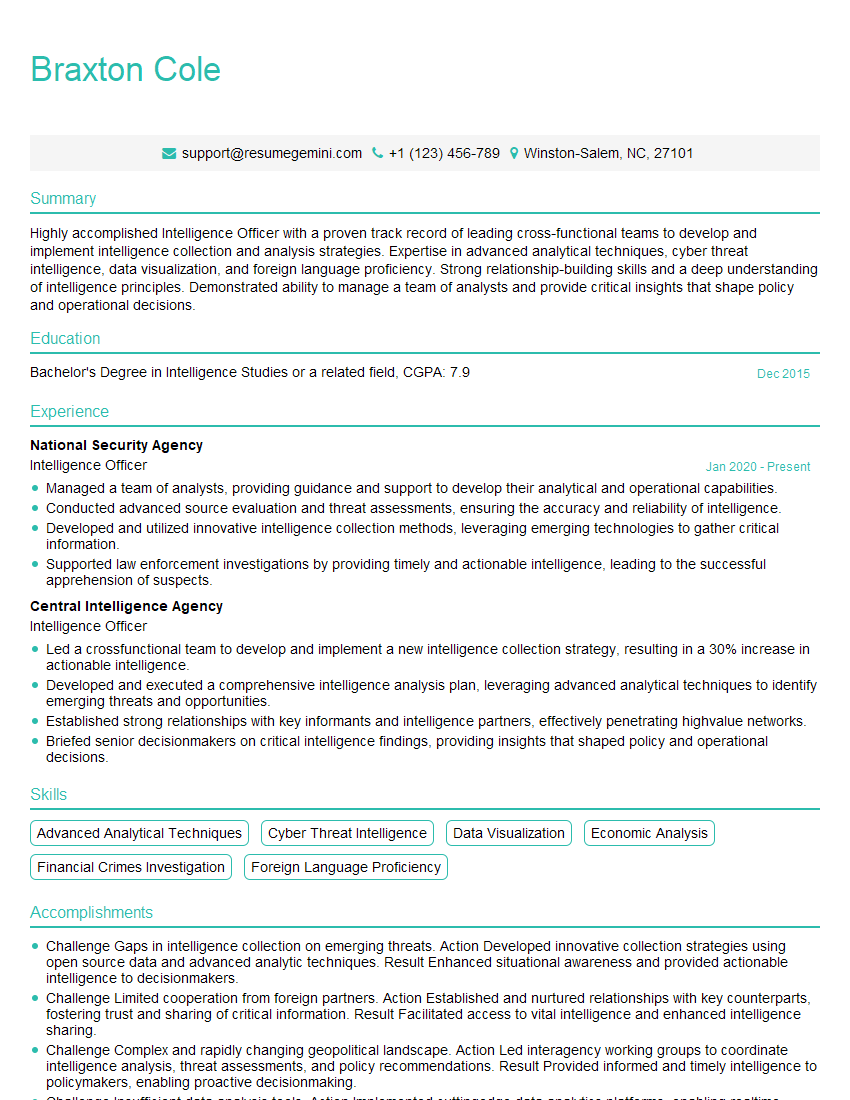
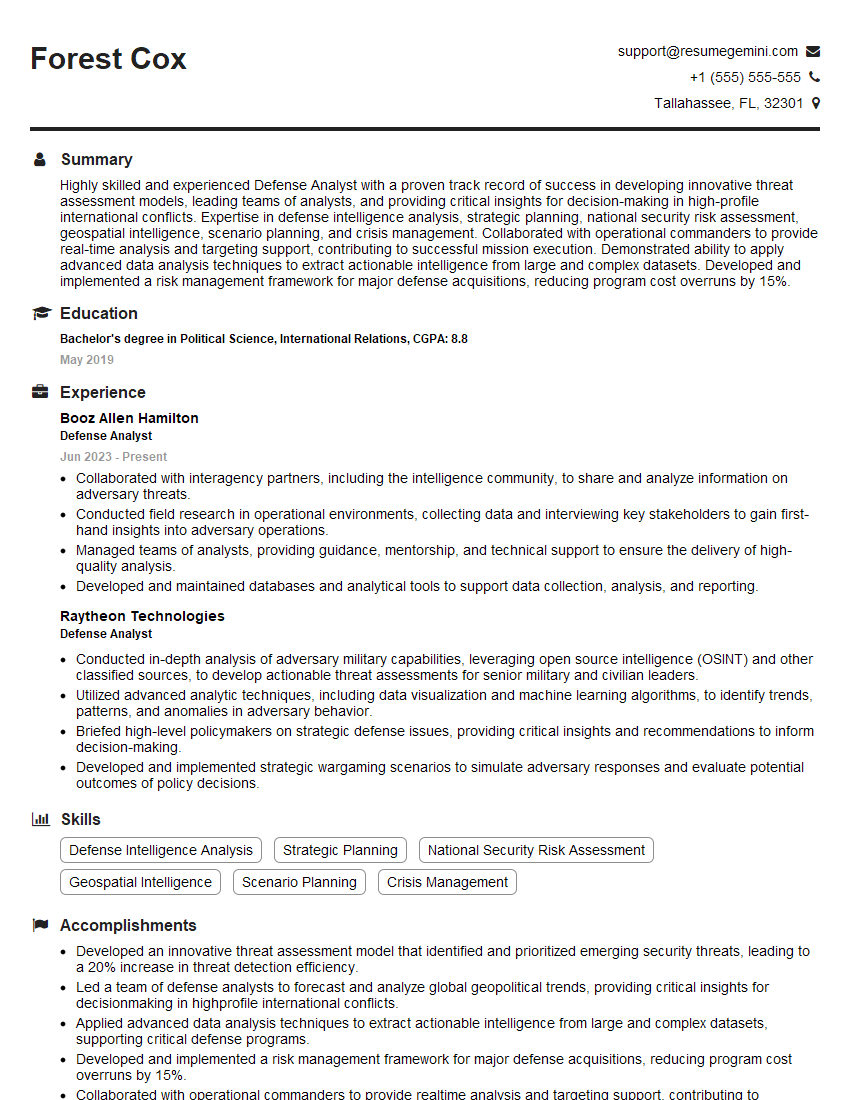
Mastering tactical analysis and reporting is crucial for career advancement in sports and related fields. It opens doors to exciting roles demanding advanced analytical skills and strategic thinking. To significantly increase your job prospects, creating an ATS-friendly resume is paramount. A well-crafted resume highlights your skills and experience effectively, increasing your chances of getting noticed. We strongly recommend using ResumeGemini to build a professional and impactful resume. ResumeGemini offers tailored resume examples for tactical analysis and reporting roles, helping you present your qualifications in the best possible light. Take advantage of these resources to create a resume that stands out from the competition.
Explore more articles
Users Rating of Our Blogs
Share Your Experience
We value your feedback! Please rate our content and share your thoughts (optional).
What Readers Say About Our Blog
Interesting Article, I liked the depth of knowledge you’ve shared.
Helpful, thanks for sharing.
Hi, I represent a social media marketing agency and liked your blog
Hi, I represent an SEO company that specialises in getting you AI citations and higher rankings on Google. I’d like to offer you a 100% free SEO audit for your website. Would you be interested?
